WATER: Po River Crisis

Po RIver of Italy. Illustration from wikipedia. Public Domain.

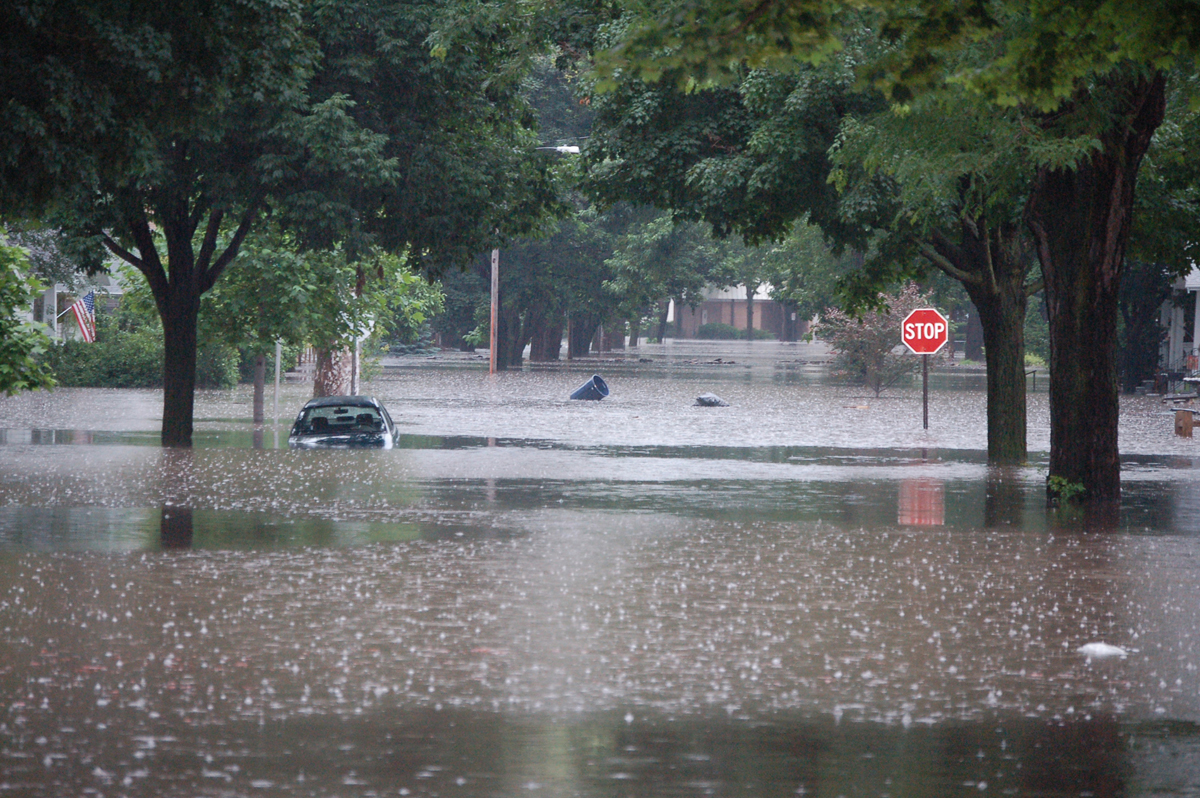
How can you grow the bountiful produce so treasured by Italy, and the world, in salty water? The worst drought in 70 years, caused by lack of snow and dearth of rain in Italy’s Po River valley, is choking once-verdant farmland. The Po River is 450 miles (650 kilometers) long, birthed in the Alps and running to the Adriatic Sea. One-third of Italy’s population lives near and depends upon the Po River, savoring the bounty of its farmland. Coursing fresh water from the Po usually overwhelms any drifting waves from the Adriatic, but with the Po’s drought, salty seawater is entering at a rate driving inland as far as 18 miles (30 kilometers). Crops are suffering, and so are cucina povera specialities like manzo all’olio or pisarei e faso.

“Italian cuisine,” by photographer who dedicated this image to the public domain and remains unknown. From wikimedia.

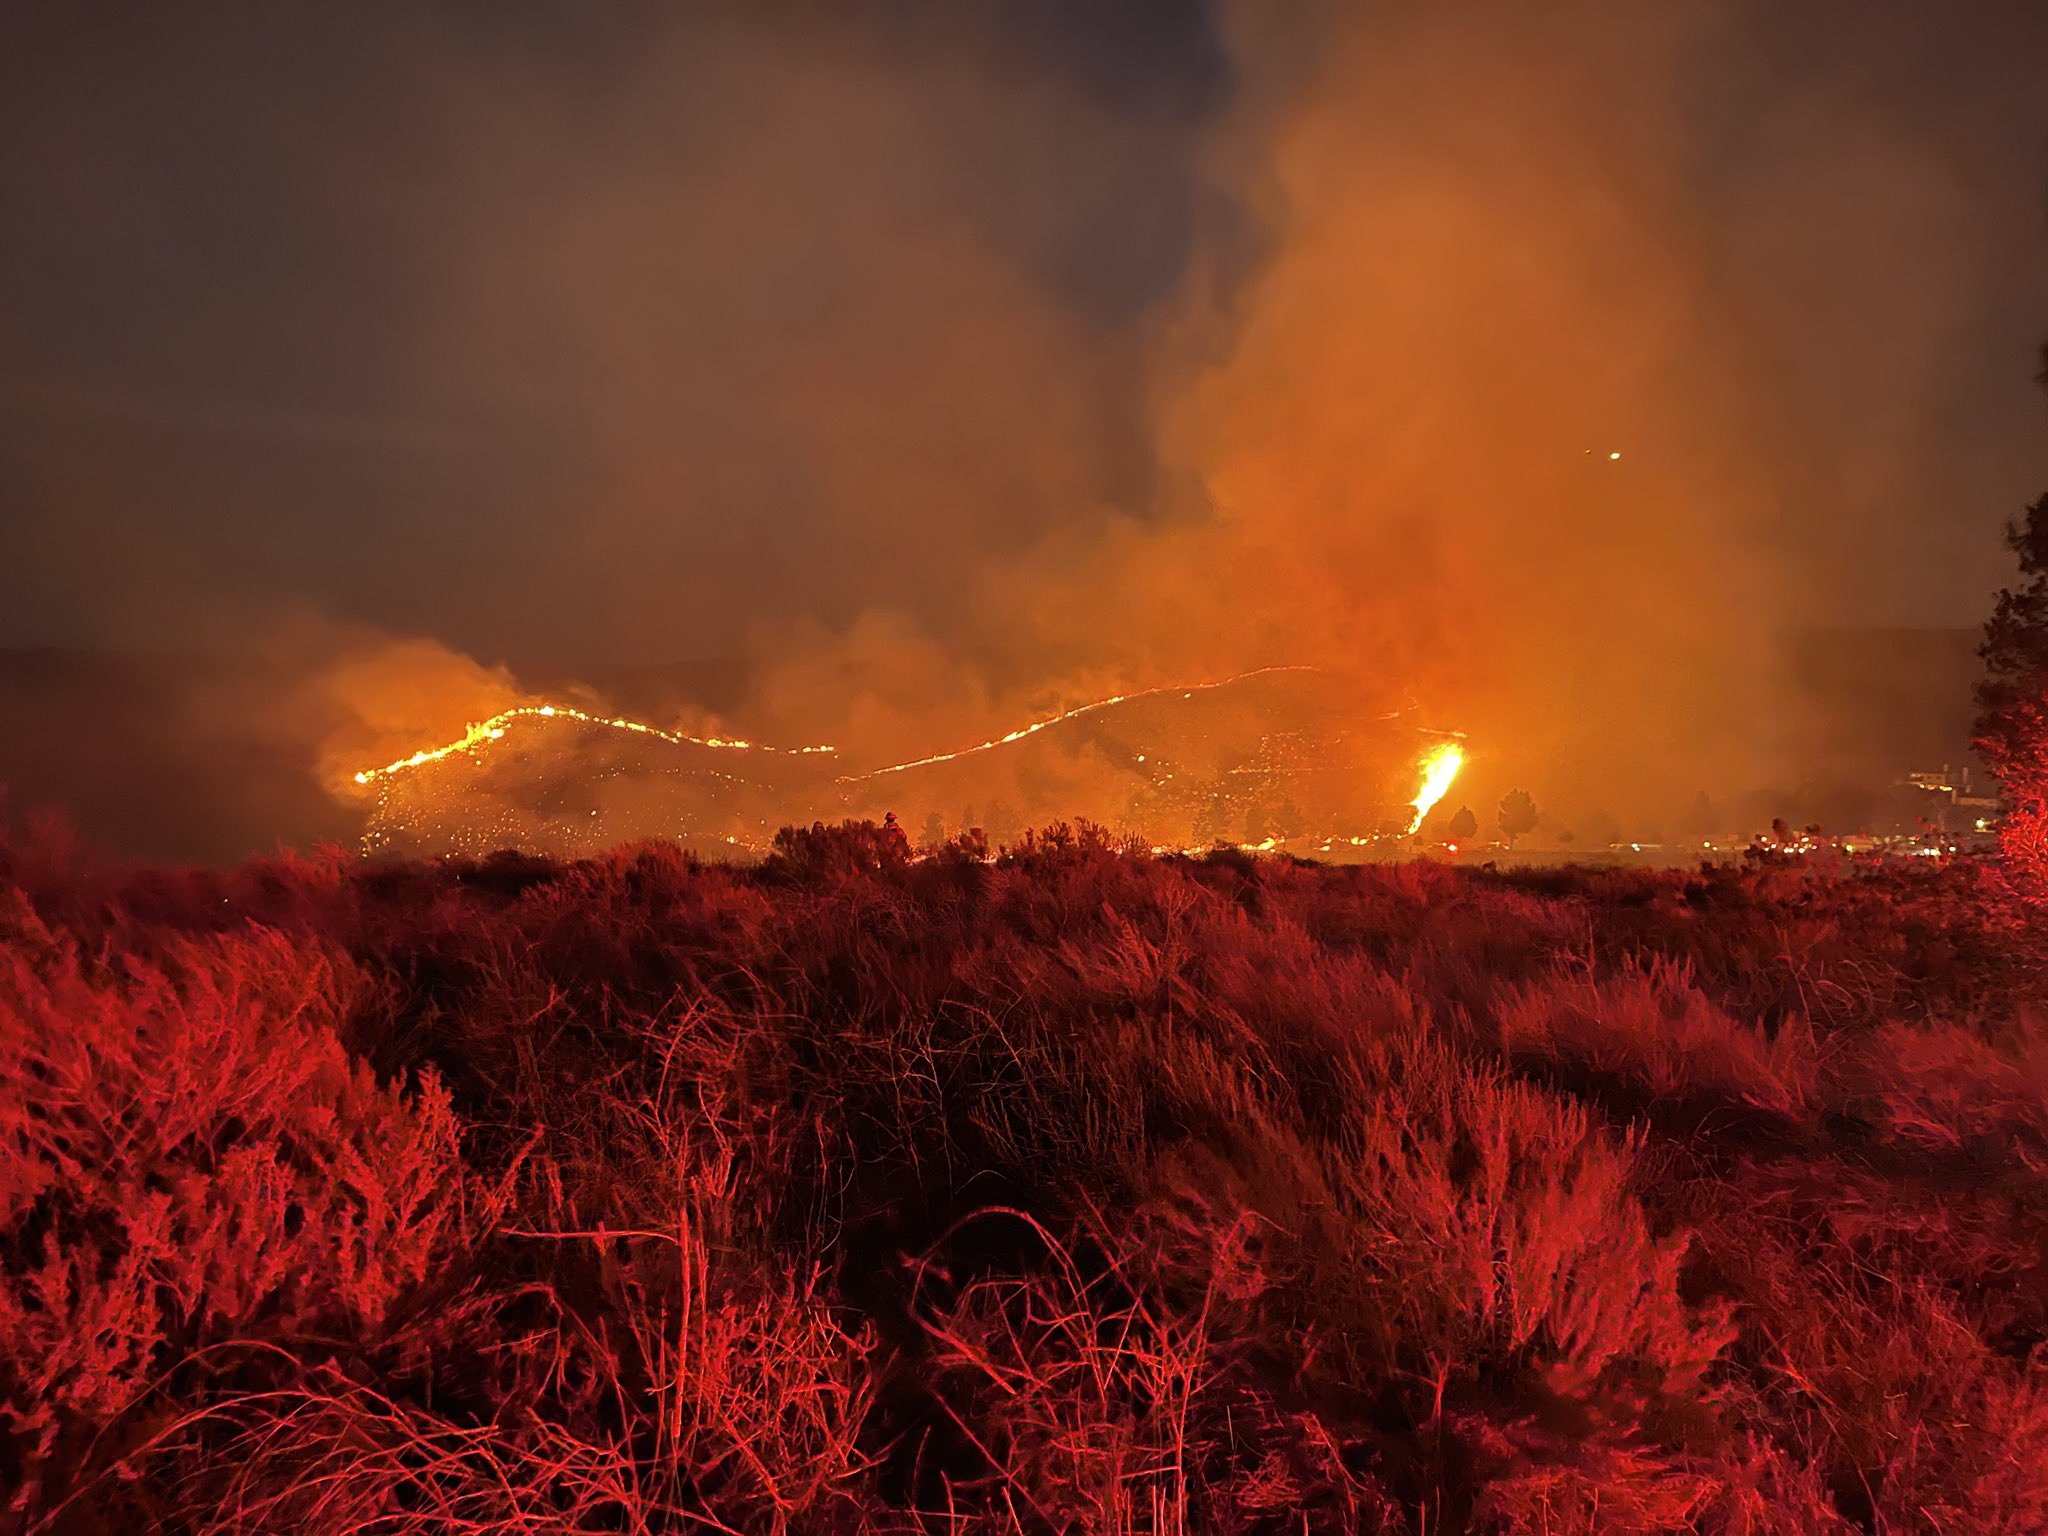
Warming weather and drought have also wreaked havoc elsewhere in Italy. The Marmolada glacier in the Italian Alps collapsed on 4 July 2022, killing seven hikers, including two experienced mountain guides. in an avalanche of melting snow mixed with rocks. Prime Minister Mario Draghi stated the cause of the tragedy was climate change. Temperatures in the area have reduced glaciers by half since warming began. More avalanches are feared.

“View of the Marmolada Glacier” taken by photographer of the Italian army circa 1915-1918. Source: www.esercito.difesa.it. Creative Commons license 2.5. With appreciation to the Italian Army.

Hydroelectricity is also affected by drought. One-fifth of Italy’s energy comes from hydroelectric facilities, mainly located in the mountains. In the first four months of 2022, hydro power fell 40% (compared with 2021) due to drought. A water plant in Piacenza was closed on 21 June due to low water levels of the Po, the river that provides the water for the hydroelectric plant. At a time when Europe is trying to reduce dependence on imported energy, hydro power is essential.

Keeping the lights in Piacenza’s magnificent cultural treasures, homes, and businesses.  Image: “Teatro Piacenza,” by photographer Lorenzo Gaudenzi, 2010. Creative commons license 3.0. With appreciation.

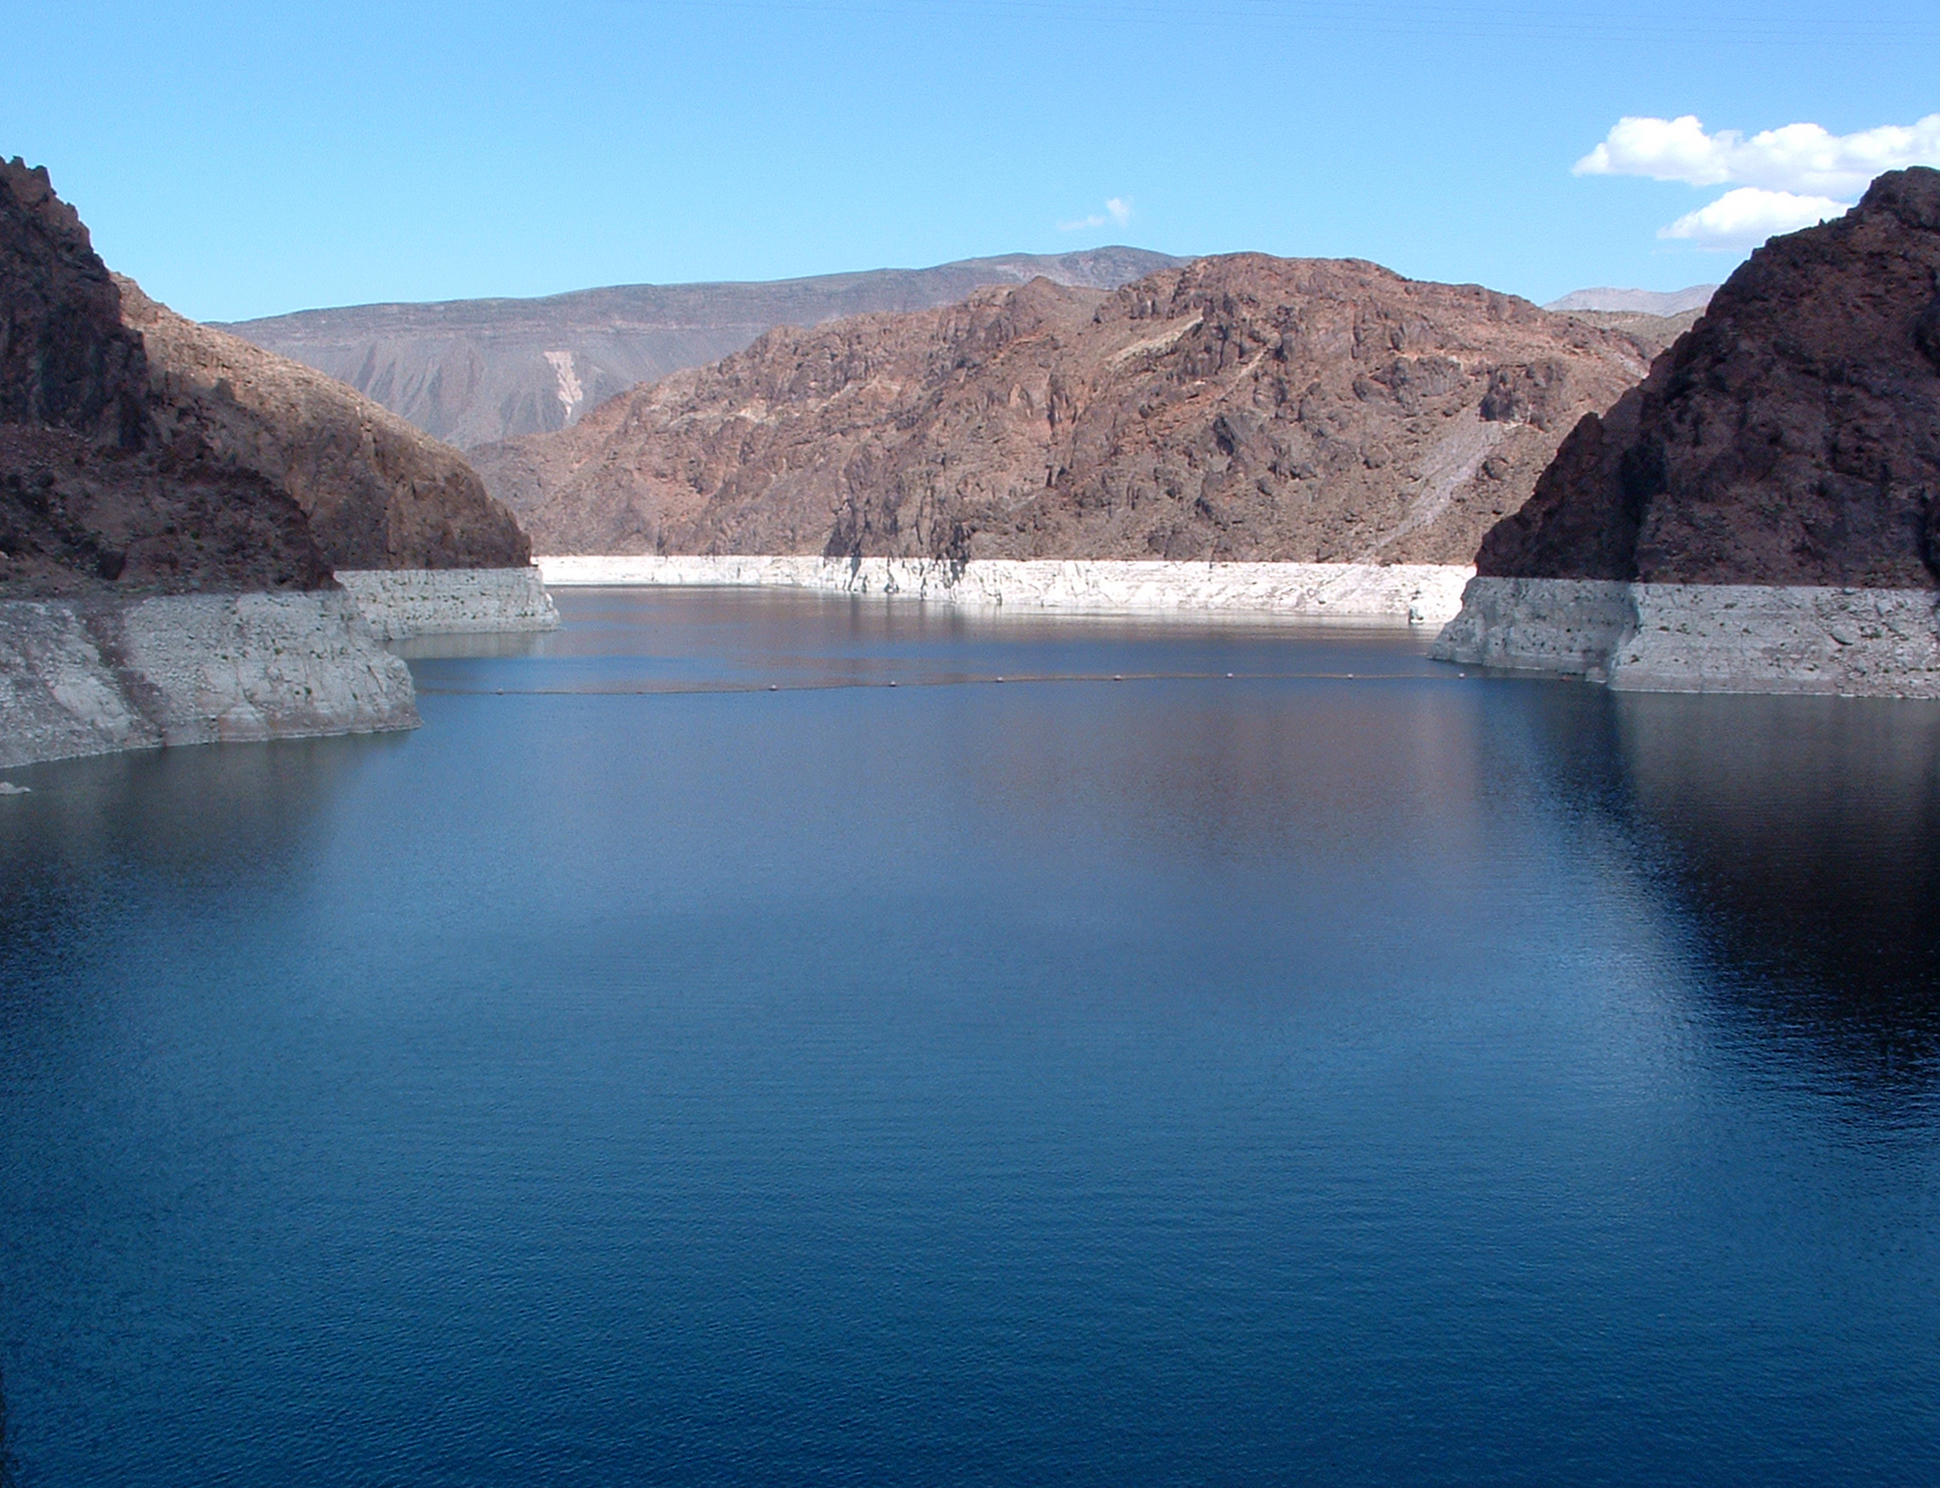
What can be done? For now, a state of emergency declaration will truck water to 125 towns that must ration drinking water. In agricultural areas, drought-tolerant crops may become the new normal. Hydroelectricity may need a rethink and redesign: the Colorado River, Lake Mead, and the Hoover Dam have recently shown hydroelectric threats. Regarding melting glaciers, there is no quick fix. Water systems may be ready for Italian creativity and innovation, like those developed by ancient Romans who built the Aqueducts. Starting in 313 bce, Romans built 11 aqueducts, yielding about 200 gallons (750 liters) per person per day. That is more than the average American has: in 1975, the average was 150 gallons (563 liters) per day; in 2021, it was down to 115 gallons. Ancient Rome had such an abundance of water that the city became known for its fountains; composer Respighi’s Fountains of Rome.

Blackman, Deane R. and A. Trevor Hodge, eds. Frontinus’ Legacy: Essays on Frontinus’ De Aquis Urbis Romae. Ann Arbor: University of Michigan Press, 2001.

Brooke, K. Lusk. Renewing the World: Water. Cambridge: Harvard Book Store, 2022. ISBN: 9798985035919. https://renewingtheworld.com

Evans, Harry B. Water Distribution in Ancient Rome. Ann Arbor: University of Michigan Press, 1994.

Parker, Jessica. “Italians wait for rain where longest river runs dry” BBC 8 July 2022. https://www.bbc.co.uk/news/world-europe-62096162

Patel, Kasha. “”Scenes from Italy’s worst drought in 70 years.” 7 July 2022. The Washington Post. https://www.washingtonpost.com/world/interactive/2022/drought-italy-po-worst-water/

Respighi, Ottorino. Fountains of Rome. Performed by Berlin Philharmonic. https://youtu.be/eGZ9oslaeak

Building the World Blog by Kathleen Lusk Brooke and Zoe G. Quinn is licensed under a Creative Commons Attribution-NonCommercial-NoDerivs 3.0 Un

WATER and ENERGY: Beyond a Drought

June 2022: an early heat wave intensifies drought. Image: “Heat Wave in United States June 13-19, 2021,” by NOAA. Public Domain, creative commons. Included with appreciation to NOAA.

Is it climate change, or just a heat wave? Maybe the former is intensifying the latter. This week, 60 million people in the United States are enduring extreme heat. Texas broke a heat record on June 12 as the electrical grid strained with the number of people turning on air conditioners. Families noted unusual new residents as outdoor insects crawled into any available shelter to escape sweltering heat. Wildfires sparked: more than 30 recent conflagrations burned one million American acres.

Drought may impact hydroelectricity. Image: “Hoover Dam and Lake Mead, – 2007” by photographer Waycool27, and dedicated to the public domain by the photographer. Included with appreciation.

Heat waves add to concern about drought, an ongoing challenge. Lake Mead, the nation’s largest water reservoir, recently marked its lowest level on record since 1930. The Colorado River, source of Lake Mead’s water, recently reported historic new water shortages, triggering enforced reductions along the Upper and Lower Basin states. Now 143 feet below the target full level, Lake Mead’s drop is as deep as the Statue of Liberty is high. That water drop threatens the water supply of millions of residents, farmers, industrial operations, and others. At 36% capacity, if the water in Lake Mead continues to fall (it has been losing more than 1,000 Olympic-sized swimming pools – every day – for the last 22 years), the hydropower capability of the Hoover Dam (which formed Lake Mead) will also be threatened. Engineers and scientists are watching: if Lake Mead drops another 175 feet, the Hoover Dam will reach “dead pool” (895 feet) and the great dam will fall silent. Because 90% of Las Vegas water comes from Lake Mead, that city will not only have less electricity but very little water. (Ramirez et al., 2021)

“Tennessee Valley Authority” Image 2977 by TVA, 2018. This image is the public domain and included with appreciation.

It’s not just Lake Mead and the Hoover Dam that are of concern due to heat and drought. The Tennessee Valley Authority, one of the nation’s first hydroelectric major achievements, warned customers both residential and commercial to turn off the lights. Nashville Electric Service asked people to turn down air conditioning. Itaipú, harnessing the Paraná River, has similarly found drought threatening its hydroelectric capability.

“Talbingo Dam of Snowy Mountains Hydroelectric.” There are 16 dams in the system. Photograph by AYArktos, dedicated to the public domain, creative commons. Included with appreciation.

Hydroelectricity, as the term indicates, is dependent upon water. Australia recently announced Snowy Hydro 2.0, in an effort to double electrical output of Snowy Mountains Hydroelectric. But the snowy part is problematic now that climate change is threatening snowmelt. Further concern is that 35% percent of the “Australian Alps” have seen wetland loss. Now, snow cover may reduce by 20% to as much as 60%.

What happens if water becomes non-renewable? Image: “Dry riverbed in California,” by NOAA, 2009. Included with appreciation.

Drought has serious consequences for agriculture, habitation, and now hydroelectricity. Hydroelectric power is one of the earliest and most widely applied methods of generating electricity from renewable sources. What happens if or when water becomes non-renewable?

Daley, Beth et al., “Snowy hydro scheme will be left high and dry unless we look after the mountains.” 22 March 2017. The Conversation. https://theconversation.com/snowy-hydro-scheme-will-be-left-high-and-dry-unless-we-look-after-the-mountains-74830

David, Molly. “Nashville Electric Service asks customers to help lessen energy use during high temperatures.” The Tennessean. 13 June 2022. https://www.tennessean.com/story/news/local/2022/06/13/heat-wave-tennessee-2022-nashville-electric-service-customers-conserve-power/7613867001/

Ramirez, Rachel, Pedram Javaheri, Drew Kann. “The shocking numbers behind the Lake Mead drought crisis.” 17 June 2021. CNN. https://www.cnn.com/specials/world/cnn-climate

Spang, Edward, William Moomaw, Kelly Gallagher, Paul Kirshen, David H. Marks. “The water consumption of energy production: An international comparison.” 2014. Environmental Research Letters. 9. 105002. 10.1088/1748-9326/9/10/105002 and https://www.researchgate.net/publication/266620784_The_water_consumption_of_energy_production_An_international_comparison

Building the World Blog by Kathleen Lusk Brooke and Zoe G. Quinn is licensed under a Creative Commons Attribution-NonCommercial-NoDerivs 3.0 Un

WATER: Mapping YOUR Climate Risk

What is your climate risk? Animation created by SaVi software from Geometry Center, University of Minnesota by Grand DixenceWikipedia for view of Iridium coverage. Image animation edicated to the public domain (CC1.0) by its creator, and included here with appreciation.

Climate change brings risk. For some, it is water: floods, storms, and sea-rise. For others, it is drought: water shortages, crop losses, and wildfires. Floods killed 920 people in Belgium and Germany, 192 in India, 113 in Afghanistan, and 99 in China – in one month (July) of 2021. Deaths from floods and related landslides took the lives of people in Bangladesh, Japan, Nepal, Pakistan, and Yemen that same year. (Davies 2021)

“Flooding in Cedar Rapids, Iowa, USA.” Photographed by Don Becker, USGS, 2008. Dedicated to the public domain (CC1.0) by United States Geological Survey and included here with appreciation.

Previous data from weather sources tracked flood risk, resulting in flood insurance for many properties (and denial of such insurance for locations too vulnerable to merit rebuilding). Water damage will only increase with climate warming, as storms grow more powerful. Rising sea levels will escalate floods and coastal inundations. Those who live in the territories of the Colorado River know well another risk related to water: drought. Water scarcity has ravaged crops, parched residential landscapes, reduced drinking water supplies, and now threatens hydropower created by the Hoover Dam. Australia, the most arid continent on Earth, is vulnerable crop loss, and electricity reduction in facilities like Snowy Mountains Hydroelectric Power.

California Fires in 2021. “Erber Fire in Thousand Oaks,” by Venture County Fire Department Public Information Office. Dedicated to the public domain (CC1.0) and included here with appreciation.

Drought also brings another danger: wild fire. Fire risk is growing with climate warming. In 1980, fire damage in the United States tallied $10 billion; in 2021, costs reached $300 billion. Worldwide, fire affects 1.5 million square miles (four million square kilometers) of Earth – each year. To picture that, the area would measure one-half of the continental United States, or more than the entirety of India. Using data from satellites like the Copernicus Sentinel-3, and the European Space Agency (ESA). the Centre for Research on the Epidemiology of Disasters tracked 470 wildfire disasters (incidents affecting more than 100 people) since 1911, totaling $120 billion in damages. The 2021 Dixie Fire in California devoured 626,751 acres (253,647 hectares); that same year, in Siberia, wildfires destroyed 3.7 million acres (1.5 million hectares) to become the largest wildfire in documented history. In 2022, the Calf Canyon-Hermits Peak fire in New Mexico continues burning over 270,00 acres and is still (at this writing) only 29% contained. The cumulonimbus flammagenitus cloud ( or CbFg or pyroCb) from the fire could be seen from space on NASA’s Aqua satellite via MODIS.

What’s your property’s climate risk? Photography by Antan0, 2010. Image of magnifying glass. CC4.0; included here with appreciation.

Would you like to know what the future looks like in your area? Now, a new mapping technology from the First Street Foundation can help you determine your risk. If you live in the United States, enter your street address, or your zip code, and you will see if you are one of 30 million properties vulnerable to flooding or wildfire. To assess your own property’s risk, click here.

Aqua Mission. Earth Observing System, NASA. https://aqua.nasa.gov/content/aqua-earth-observing-satellite-mission

Centre for Research on the Epidemiology of Disasters. https://www.cred.be

Copernicus Sentinel-3. “Measuring Earth’s oceans, land, ice, and atmosphere to monitor and understand global dynamics.” European Space Agency (ESA). https://www.esa.int/Applications/Observing_the_Earth/Copernicus/Sentinel-3

Davies, Richard. “Worldwide – Over 920 People Killed in Floods and Landslides in July 2021.” 2 August 2021. Floodlist. https://floodlist.com/asia/world-floods-july-2021

First Street Foundation. “Make climate risk accessible, easy to understand, and actionable for individuals, governments, and industry.” https://firststreet.org/mission/

Haddad, Mohammed and Mohammed Hussein. “Mapping Wildfires around the World.” 19 August 2021. Al Jazeera. https://www.aljazeera.com/news/2021/8/19/mapping-wildfires-around-the-world-interactive

Risk Factor. “A property’s flood or fire factor.” https://riskfactor.com

Building the World Blog by Kathleen Lusk Brooke and Zoe G. Quinn is licensed under a Creative Commons Attribution-NonCommercial-NoDerivs 3.0 Un


CITIES: No Mow May

NO MOW MAY. This month, let your lawn grow with wildflowers to feed seasonal pollinators like bees. Photo: “Wildflowers” by Richard Croft, 2007. Wikimedia CC 2.0. Included with appreciation.

Public parks like Boston’s Greenway or New York City’s Central Park might be the lungs of the city, but urban and suburban yards may be the pop-up restaurants for seasonal pollinators like bees that will help the world through climate change. American lawns occupy 40 million acres, and may be the largest irrigated “crop” in the United States – three times more than irrigated corn. (Milesi, University of Montana and NOAA National Geophysical Data Center)

“Automaton Lawn Mower by Ransomes, Sims & Jeffries of Ipswich, England,” advertisement circa 1867. Public Domain.

No Mow May is an organization in the United Kingdom advocating the absence of lawn mowing, letting lawns grow wild, for this month, offering a spring habitat and feeding ground of wildflowers and clover critical for emerging bees and early pollinators. In addition to homes, colleges are included: Lawrence University recently joined the organization Bee City, USA, and its affiliate: Bee Campus USA.

Fewer lawns, more bees. “Abeille” by Jean-Raphaël Guillaumin, 2010. Wikimedia, CC 2.0. Included with appreciation.

Yards, and campuses, participating in No Mow May noted three times more bee species abundance and five times more bee attendance than in lawn areas.

Another benefit of No Mow May? Water retention. People water lawns. In an era of drought and water scarcity, lawns may be phased out. That what happened in Las Vegas, Nevada.

Lake Mead, water reservoir of the Colorado River, supplies Las Vegas with water. A new law by the Southern Nevada Water Authority prohibits lawns, and watering of nonfunctional turf, in response to drought conditions on the Colorado River. Image: “Lake Mead” by Kjkolb, public domain. Included with appreciation.

A new law, related to water shortages in the Colorado River, enacted by the Southern Nevada Water Authority, decreed first-ever permanent prohibition of non-functional turf (soccer fields are functional, household lawns are not). Residents are digging up grass and replacing it with rocks and cactus, creating xeriscapes, a kind of landscaping reducing or eliminating need for irrigation.

Do you have grass in your yard or on your campus? Participate in No Mow May: for a printable yard sign, click here

Bee City USA. https://beecityusa.org

Bee Campus USA. https://beecityusa.org/current-bee-campus-use-affiliates

Del Toro, Israel and Relena R. Ribbons. “No Mow May lawns have higher pollinator richness and abundances: An engaged community provides floral resources for pollinators” 22 September 2020. National Library of Medicine: National Center for Biotechnology Information. doi: 10.7717/peerj.10021

Milesi, Cristina. “More Lawns than Irrigated Corn.” 8 November 2005. Earth Observatory, NASA.gov. https://earthobservatory.nasa.gov/features/Law/lawn2.php

No Mow May. Plantlife.  https://www.plantlife.org.uk

Osann, Ed. “Toward Sustainable Landscapes: Restoring the Right NOT to Mow.” 6 May 2016. Natural Resources Defense Council. https://www.nrdc.org/resources/toward-sustainable-landscapes-restoring-right-not-mow

Southern Nevada Water Authority. “An Act relating to water; prohibiting, with certain exceptions, the use of water from the Colorado River to irrigate nonfunctional turf on certain properties.” Assembly Bill No. 356, 22 March 2021. https://www.leg.state.nv.us/Session/81st2021/Bills/AB/AB356_R1.pdf

Building the World Blog by Kathleen Lusk Brooke and Zoe G. Quinn is licensed under a Creative Commons Attribution-NonCommercial-NoDerivs 3.0 Un


WATER: Noah’s Ark for Marine Life

“Noah’s Ark,” by Edward Hicks. Philadelphia Museum of Art. Public Domain, USA. Image: wikimedia

Coral reefs cover just 1% of the ocean floor but support 25% of all marine life. According to The Ocean Agency’s founder Richard Vevers, even if we meet the targets of the Paris Agreement, we may lose 90% of our coral reefs by mid-century due to ocean warming and acidification that causing coral reef bleaching. Working with the Centre for Excellence in Environmental Decisions at the University of Queensland, The Ocean Agency and a team of scientists selected 50 coral reefs that are most likely to survive climate change with a little help. The reefs chosen are a sample “large enough to allow protection of reefs in all major regions” (UQ 2017).

“Coral planting and reef restoration,” by Profmauri, 2011. Creative Commons 3.0, wikimedia.

Given this ‘Noah’s Ark’ for coral and marine life, how can this precious resource be preserved? Much like the examples of humans helping Nature as in the National Trails System, Roman Aqueducts or the New River, natural coral reefs may get a boost from engineering innovations. Coral can be grown in a lab, where growth that could take 100 years in the ocean can be accomplished in two years under laboratory conditions. Once the tiny corals are ready for transplanting, they can be placed on reefs that are suffering but still able to recover; it’s a process known as “reskinning.”

“The Silent Evolution” by James deCaires Taylor. Photographer, allenran 917, 2014. Creative Commons 2.0.

Another option: forming new coral reefs using underwater sculptures like those created by James deCaires Taylor for the Australia’s Museum of Underwater Art on Great Barrier Reef, and Mexico’s Mesoamerican Reef, largest in the Western Hemisphere, for the Museo Subacuático de Arte. Some debate whether such sculptures are helping or harming marine life. Similar underwater sculpture gardens created by Angeline Chen and Kyle Block, founders of Global Coralition, are located in Koh Tao, Thailand, and in the Dominican Republic, where art honors the traditional water deities of the Arawak/Taino cultures of the Caribbean.

“Blue Spotted Stingray in Koh Tao, Thailand coral reef,” photographer Jan Derk, 2004. Generously dedicated to the public domain by Jan Derk. Creative Commons. With appreciation to Jan Derk.

Vevers worried that coral is an emergency that is invisible to all but divers and the denizens of the ocean. To make the invisible visible (coincidentally the theme for World Water Day 2022 referencing groundwater), The Ocean Agency reached out to Jeff Orlowski and Larissa Rhodes to collaborate on a Netflix film: “Chasing Coral.” During filming, the most dangerous coral bleaching event in history occurred. The film debuted at Sundance and has helped to make coral’s plight more accessible. Watch the film here.

“Coral reef locations,” by NASA, 2006, from Millennium Coral Reef Landsat Archive. Public Domain. 50 are chosen for “Noah’s Ark” preservation. For information on each reef, visit http://seawifs.gsfc.nasa.gov/landsat.pl

Art may help to raise awareness, and respect, for the world’s coral reefs. In addition to nurturing 25% of marine life, coral provides 1 billion people with food, jobs, and income that generates $375 billion in economic benefits. Coral reels are not visible to most of us, so they may be out of mind. But there is much each of us can do. Recycling plastic that can harm reels and marine life, being cautious about the use of some sunscreens when enjoying the beach, or by supporting ocean sustainability and coral reef regeneration, we have an opportunity to build a modern-day Noah’s Ark for coral.

Beyer, Hawthorne L, et al., “Risk-sensitive planning for conserving coral reefs under rapid climate change.” 27 June 2018. Conservation Letters, Volume 11, Issue 6, e12587. https://doi.org/10.1111/conl.12587

DeCaires, Jason Taylor. “An underwater art museum, teeming with life.” TED talk. December 2015. https://www.ted.com/talks/jason_decaires_taylor_an_underwater_art_museum_teeming_with_life?language-en

Drury, Madeleine. “Are giant underwater sculptures helping or harming marine life?” 07/09/2021. Euronews.com. https://www.euronews.com/green/2021/o7/13/are-giant-underwater-sculptures-helping-or-harming-marine-life

Global Coralition. https://www.globalcoralition.org

Netflix and Exposure Labs: “Chasing Coral,” Film. https://www.youtube.com/watch?v=aGGBGcjdjXA

The Ocean Agency, “50 Reefs.” Video: https://youtu.be/pFfVpO_q4sg

University of Queensland, Global Change Institute. “Which reefs are the most important to save?” 24 February 217. https://www.uq.edu.au/news/article/2017/02/which-reefs-are-most-important-save

Vevers, Richard. “Interview,” https://youtu.be/8hMAgr4p7Sg

Wilson, Amy. “Microfragmentation: a breakthrough for coral reef restoration.” 18 September 2018. Medium.com. https://medium.com/@amykwilson/microfragmentation-a-breakthrough-for-coral-reef-restoration-6a2e86c4e2

Building the World Blog by Kathleen Lusk Brooke and Zoe G. Quinn is licensed under a Creative Commons Attribution-NonCommercial-NoDerivs 3.0 Un

World Water Day – Making the Invisible Visible

World Water Day 2022. “Splash!” by José Manuel Suárez, 2008. Image: Wikimedia CC 2.0 creative commons. Included with appreciation.

Today is World Water Day, begun by the United Nations as an international day of observance. This year’s theme is “Groundwater – Making the Invisible Visible.” Did you know that groundwater is the largest source of freshwater on earth? How can we sustain and renew this essential element?

Vista nocturna del Río Bravo, frontera El Paso – Ciudad Juárez.” By Iose, 2007. Dedicated by the photographer to the public domain and included here with thanks. Image: Wikimedia.

Groundwater is transnational. Rivers, above-ground water resources, are often boundary lines separating countries. An example is the Rio Grande (called Río Bravo in México), a river that separates what is now known as the United States and México. Another US/México river whose resources are apportioned, and sometimes disputed, is the Colorado River. But the groundwater beneath both nations is also noteworthy: there are as many as twenty  transboundary aquifers shared by México and the United States.

“Groundwater Withdrawals 2010.” by Herbert and Doell, 2019.  Image: CC 4.0 wikimedia. With appreciation.

Transboundary aquifers demand cooperation. Because groundwater is critically important as a freshwater source, and because so many nations share underground aquifers, groundwater may become one of the most important areas of cooperation  –  and perhaps serve as the water of peace.

Interested to know more about world water, and how we can sustain and renew the Water Planet? You might like to explore this new book: Renewing the World: Water.

Renewing the World: Water explores the future of the water planet. Image: “The Earth seen from Apollo 17.” Photo by nasa.gov. public domain. Included here with appreciation.

Brooke, K. Lusk. Renewing the World: Waterhttps://renewingtheworld.com

Eckstein, Gabriel. “Buried Treasure or buried Hope? The Status of Mexico-US Transboundary Aquifers under International Law.” International Community Law Review 13 (2011): 273-290. https://scholarship.law.tamu.edu/facscholar/129/

International Groundwater Resources Assessment Centre (IGRAC). “Transboundary Aquifers of the World” https://www.un.igrac.org/sites/default/files/resources/files/TBAmap_2015.pdf

Herbert, Claudia and Petra Doell. “Global assessment of current and future groundwater stress with a focus on transboundary aquifers.” Water Resources Research,  55(3), 4760-4784. DOI:10.1029/2018WR023321.

UN-Water. www.unwater.org

United States Bureau of Reclamation. “Environmental Flows in the Rio Grande-Río Bravo Basin.” 1 February 2022. Drought Adaptation Webinar Series. VIDEO: https://www.youtube.com/watch?v=5I-prBCOjTs

World Water Day. https://www.worldwaterday.org/

Building the World Blog by Kathleen Lusk Brooke and Zoe G. Quinn is licensed under a Creative Commons Attribution-NonCommercial-NoDerivs 3.0 Un

CITIES: Plastic – Part 1, The Problem

Only 9% of plastic waste is recycled. Now the UN will develop a treaty to limit plastic pollution. Image: “Plastic bottles in a pickup truck for recycling.” by Streetwise, 2010. Public domain: creative commons.

Plastic: it is the convenience – and scourge – of our Anthropocene era. Most of it lives in cities, and then landfills. Diplomats are now turning their collective attention to plastic pollution. Modeled on the 2015 Paris Agreement, developed in the city of the Eiffel Tower, the first stage of the UN initiative is assessment: how much plastic is being manufactured? With what chemicals? Who are the main players? What happens when plastic is discarded?

Plastic Facts and Figures:

Since its invention, 8.3 billion tons of plastic have been produced

Only 9% of all plastic waste ever produced has been recycled. Most is in landfills

United States generates 287 pounds of plastic waste, per person, per year

During the pandemic, single-use plastic wrapping products for safety increased 19%

8 million metric tons of plastic enter global waters – each year (that is equivalent to a dump truck offloading every minute of every day

Microplastics are now found in the organs of fish

Microbeads and plastic fibers are found in 80% of the world’s tap water

Led by Espen Barth Eide, Norway’s Minister for Climate and the Environment, the UNEA-5 team will convene in Nairobi on 28 February 2022. Preparing for that meeting, we will next take a look the main manufacturers, and preview some innovations that may signal hope.

Birnbaum, Michael and Min Joo Kim. “Plastics production is skyrocketing. A new U.N. treaty effort could cap it. 8 February 2022. The Washington Post. https://www.washingtonpost.com/climate-solutions/2022/02/08/plastic-pollution-un-treaty

Ingilizian, Zara. “Waste-free consumption: 3 reasons why cities will lead.” 14 June 2019. World Economic Forum: Shaping the Future of Consumption. https://www.weforum.org/agenda/2019/06/3-reasons-why-cities-can-stem-the-tide-of-the-plastic-crisis/

United Nations Environment Programme (UNEP). “Our planet is drowning in plastic pollution – it’s time for change!” https://www.unep.org/interactive/beat-plastic-pollution

UNEP-5. https://www.genevaenvironmentnetwork.org/resources/updates/towards-unea-5-2/

Building the World Blog by Kathleen Lusk Brooke and Zoe G. Quinn is licensed under a Creative Commons Attribution-NonCommercial-NoDerivs 3.0 Un

WATER: Jason and the Return of the Argonauts

“Argo Temperature/Salinity Float Network” by Dmcdevit, 2007 for Global Warming Art. License GNU Free 1.2. Image: wikimedia.

Recent tornadoes, storms, floods caused loss of life and damage of property. While warmer temperatures are known to fuel and intensify tornadoes, scientists are uncertain if tornadoes that swept across four U.S. states were caused by climate change. What is certain is unseen, but even more troubling. Antarctic currents are changing. The above NASA illustration shows the movement of ocean currents including the Antarctic Circumpolar Current:  at 1,200 miles (1,931 kilometers) wide and two miles (3 kilometers) deep, it is the globe’s largest current. Its motion draws the deepest water from the Atlantic, Indian, and Pacific oceans to swirl it to the surface. In the process, the water exchanges heat and carbon dioxide with the atmosphere. It’s called an upwelling.

“Upwelling” in an animation by NOAA. Image: public domain, wikimedia.

With a warming world, upwelling may release more carbon dioxide that had formerly been sequestered in the blue deep of the oceans. Oceans have sequestered 25% of carbon dioxide and 90% of excess heat from burning fossil fuels. What if that were to change? Moreover, the warming upwelling waters that travel through and beneath Antarctic are melting ice shelves like those near the Thwaites glacier. If those ice sheets melt into the ocean, sea rise could advance by as much as 12 feet (3.66 meters). Ice sheets act as a blockade, protecting glaciers: if that blockade breaks, glaciers will also melt more quickly and release even more water to rising seas. (Fountain and White, 2021) Watch a video about the Thwaites glacier here.

“Thwaits Glacier.” NASA, 2014. Public domain, wikimedia.

What can be done? Gathering more data is a first step. Robotic autonomous floats called ‘Argo Floats‘ are a small army of 3900 presently bobbing in the world’s oceans, sending back data. When below water for their ten-day shift, Argo Floats gather data; when they pop up to the surface, they transmit. The National Oceanic and Atmospheric Administration (NOAA)  and the Global Ocean Monitoring and Observing (GOMO) program is named after the mythical Jason and the Argonauts who sailed to find the Golden Fleece.

“Scenes from the Story of the Argonauts” by Biagio d’Antonio, circa 1472-1516. From the Metropolitan Museum of Art, donated to wikimedia for public domain open access use.

Jason and the Argonauts may be one of the oldest myths of a hero’s quest. The present initiative references not only the ancient Greek myth, but also the ocean mission. The title also indicates its complementary relationship with the Jason satellite altimeters that study the situation from above. The instruments called ‘Argo Floats:’ the measurements of sea surface height are termed ‘Jason measurements’ that report temperature and salinity. (Brown 2019). In 2020, Antarctica observed a 200-year anniversary. Polar regions are among the most important places for climate change, due to a process termed polar amplification. The Antarctic Treaty, signed in 1959, offers some protections, but the ban on mining of Antarctic minerals expires in 2048. If or when the Antarctic Treaty is revised, what provisions should be upheld, changed, or added?

Argo Program. NOAA. https://globalocean,noaa.gov/Research/Argo-Program

Brown, Fiona “What we learnt from spending winter under the Antarctic sea ice.” 15 May 2019. CSIROscope. https://blog.csiro.au/

Fountain, Henry and Jeremy White. “Rising from the Antarctic, a Climate Alarm.” 14 December 2021. New York Times. https://www.nytimes.com/interactive/2021/12/13/climate/antartic-climate-change.html?referringSource=articleShare

Institute for Marine and Antarctic Studies (IMAS). “Geoengineering The Southern Ocean? A Transdisciplinary Assessment.” University of Tasmania, Australia. https://www.imas.utas.edu.au/home/home-features/arc-laureate-fellowship-geoengineering-the-southern-ocean-a-transdisciplinary-assessment

Jason satellite program mission. NOAA. https://sealevel.jpl.nasa.gov/missions/jason-1/summary

Ramirez, Rachel. “Scientists warn a critical ice shelf in Antarctica could shatter within five years.” 14 December 2021. CNN. https://www.cnn.com/2021/12/14/world/antarctic-thwaites-glacier-climate-warming/index.html

Silvano, Alesandro et al., “Seasonability of warm water intrusions onto the continental shelf near the Totten Glacier.” 3 May 2019. Journal of Geophysical Research: Oceans/Volume 124, issue 6, pages 4272-4289. https://doi.org/10.1029/2018JC014634 and https://agupubs.onlinelibrary.wiley.com/doi/full/10.1029/2018JC014634

Building the World Blog by Kathleen Lusk Brooke and Zoe G. Quinn is licensed under a Creative Commons Attribution-NonCommercial-NoDerivs 3.0 Un


WATER: Foreseeing the Future

New Orleans in 1803. Image: “Under My Wings Everything Prospers” by J. L. Bouqueto de Woiseri. 1 January 1803. Public Domain. Image: wikimedia commons.

Hurricane Ida hit Louisiana, in August 2021, bringing severe wind and water. New Orleans was watching. After Hurricane Katrina, in 2005, the city built a flood-prevention system of gates, levees, pumps, and walls. Sixteen years later, almost to the day, Ida tested Katrina’s resilient infrastructure. The city emerged relatively unscathed( Hughes, 2021). But just 60 miles away, storm surge toppled the Lafourche Parish levee. Overwhelmed by floods, damaged sanitation and sewage systems threatened public health. The discrepancy between a prepared city and an unprotected town foretells the future of coastal communities in climate change.

Hurricane Katrina in 2005 caused damage that resulted in the building of a storm protection system, tested by Hurricane Ida in 2021. Image: “Hurricane Katrina, 28 August, 2005” from NOAA. Public Domain.

It’s not just flooding. Even though New Orleans avoided Katrina’s flooding in Ida, there were other dire effects. Like power outages. Hundreds of thousands of people remained without electricity a week after the storm. Refrigerators were off, so were air-conditioners: in the 90 degree (F) heat, the situation was dangerous. Those who could escaped to nearby places with electricity for an “evacuation vacation.” Many were not so fortunate.

“Hurricane Ida at Landfall in Port Fourchon, Louisiana, 29 August 2021. Image: weather.gov. Public Domain.

Coastal communities face an uncertain yet certain future. By 2040, providing storm-surge systems like sea walls for American cities with populations greater than 25,000 is estimated to cost $42 billion – that would include New Orleans. But what about Lafourche Parish? Protecting smaller communities and towns would raise the cost to $400 billion. (Flavelle 2021). Protecting against flooding is only part of the problem, however: wind damage to above-ground electrical poles, wires, and transformers is cause for alarm. During Hurricane Ida, 902,000 customers lost power when 22,000 power poles; 26,000 spans of wire, and 5,261 transformers were damaged or lost – more than Katrina, Zeta, and Delta combined (Hauck 2021).

“Map illustrating areas of the Netherlands below sea level.” By Jan Arkestejin. Pubic Domain Image: wikimedia.

Even with abundant funding, infrastructure takes time to build. Storms, however, will not stop. While rebuilding more resilient storm barrier and electrical systems, communities may look to the Protective Dikes and Land Reclamation practices of The Netherlands as a case example of immediate resilient response. The Dike Army (Dycken Waren), composed of residents responding together in times of need, was part of the system. As Louisiana, and other areas significantly damaged by Hurricane Ida, consider how to rebuild, it may be time to call to arms a new kind of Dike Army, perhaps a regional Civilian Climate Conservation Corps (4C), to serve and protect coastal communities and habitats: both terrestrial and marine. Disaster response would be in addition to the goals of the Civilian Climate Corps proposal of the US in January 2021. The 4C’s motto is up for a vote: some want “For Sea” and some like “Foresee.” What’s your vote?

“CCC” pillow from CCC museum in Michigan, USA. Image: public domain.

Flavelle, Christopher. “With More Storms and Rising Seas, Which U.S. Cities Should Be Saved First?” 19 June 2019. The New York Times.

Hauck, Grace. “Week after Hurricane Ida’s landfall, hundreds of thousands still without power.” 5 September 2021. USA TODAY. https://wwwusatoday.com/story/news/nation/2021/09/05/hurricane-ida-louisiana-residents-without-power-families-homeless/5740682001/

White House, Biden-Harris. “Civilian Climate Corps.” 27 January 2021. https://www.whitehouse.gov/briefing-room/statements-releases/2021/01/27/fact-sheet-president-biden-takes-executive-actions-to-tackle-the-climate-crisis-at-home-and-abroad-create-jobs-and-restore-scientific-integrity-across-federal-government/

Building the World Blog by Kathleen Lusk Brooke and Zoe G. Quinn is licensed under a Creative Commons Attribution-NonCommercial-NoDerivs 3.0 Unp

ENERGY: HOT(TER)

“SUN” by NASA, STEREO Science Center, 2010. Image: public domain.

The long, hot summer – but it’s not August, it’s not even 2021. It’s the whole 21st century. The International Panel on Climate Change (IPCC) released findings today. Here is a summary:

  • Climate change is widespread, rapid, and intensifying
  • Warming is speeding up
  • Every region of the world is facing climate change
  • Human influence is a major cause – and could be the cure (IPCC 9 August 2021)
Do we have the power to respond? Image: TVA Sign at Franklin D Roosevelt Presidential Library and Museum, Hyde Park, NY, USA. By Photographer Billy Hathorn, 2015. Image: CC0 1.0 Public Domain. Wikimedia.

It’s (almost) not too late. Can we meet the challenges? Some changes, like rising seas, may be permanent. Other results may last a century but could be eased or even reversed. There is still time to determine the future we choose (Figueres and Rivett-Carnac, 2020). Throughout history, people have responded to crisis with innovation. Energy transitions have been turning points in civilization: Tennessee Valley Authority hydroelectric power gave the world the first homes with refrigerators when the TVA opened the town of Norris. Danger led to the Manhattan Project and development of atomic energy. Geothermal, solar, wind, and wave power offer options in every region.

“Spinning Globe Map.” by Anonymous101, 2007. Image: public domain, wikimedia commons.

Regions all share climate change but conditions will vary. “For the first time, the Sixth Assessment Report provides a more detailed regional assessment of climate change, including a focus on useful information that can inform risk assessment, adaptation, and other decision-making, and a new framework that helps translate physical changes in the climate – heat, cold, rain, drought, snow, wind, coastal flooding and more – into what they mean for society and ecosystem.” (IPCC 2021)  Regional information and options can be explored in detail in the newly developed Interactive Atlas here.

Climate Nexus. “IPCC: Human-Caused Climate Change Impacts Severe, Widespread.” 9 August 2021. https://climatenexus.org/climate-change-news/ipcc-climate-change-2021-report/

Figueres, Christiana and Tom Rivett-Carnac. The Future We Choose. 2020. ISBN: ;9780593080931.

International Panel on Climate Change (IPCC). “Sixth Assessment: Summary.” https://www.ipcc.ch/site/assets/uploads/2021/08/IPCC_WGI-AR6-Press-Release_en.pdf

IPCC “What Matters?” 2018. VIDEO: https://www.ipcc.ch/sr15/mulitimedia/video/

Plumer, Brad and Henry Fountain. “A Hotter Future Is Certain, Climate Panel Warns. But How Hot Is Up to Us.” 9 August 2021. New York Times. https://www.nytimes.com/2021/08/09/climate/climate-change-report-picc-un.html?referringSource=articleShare

Building the World Blog by Kathleen Lusk Brooke and Zoe G. Quinn is licensed under a Creative Commons Attribution-NonCommercial-NoDerivs 3.0 Unp