ENERGY: Agreeing on a better future


U.S. leaders finally agree on climate. Image: “Handshake icon” by Masur, 2007. Wikimedia creative commons public domain. Included with appreciation.

The largest energy investment in United States history just made history. Climate and energy policy, worth $369 billion, has been agreed. Incentives and actions in the bill are estimated to lower American carbon emissions by 40% by 2030.

“High Park Wildfire, USA.” Image from U.S. Department of Agriculture, 2012. Wikimedia public domain, included with appreciation.

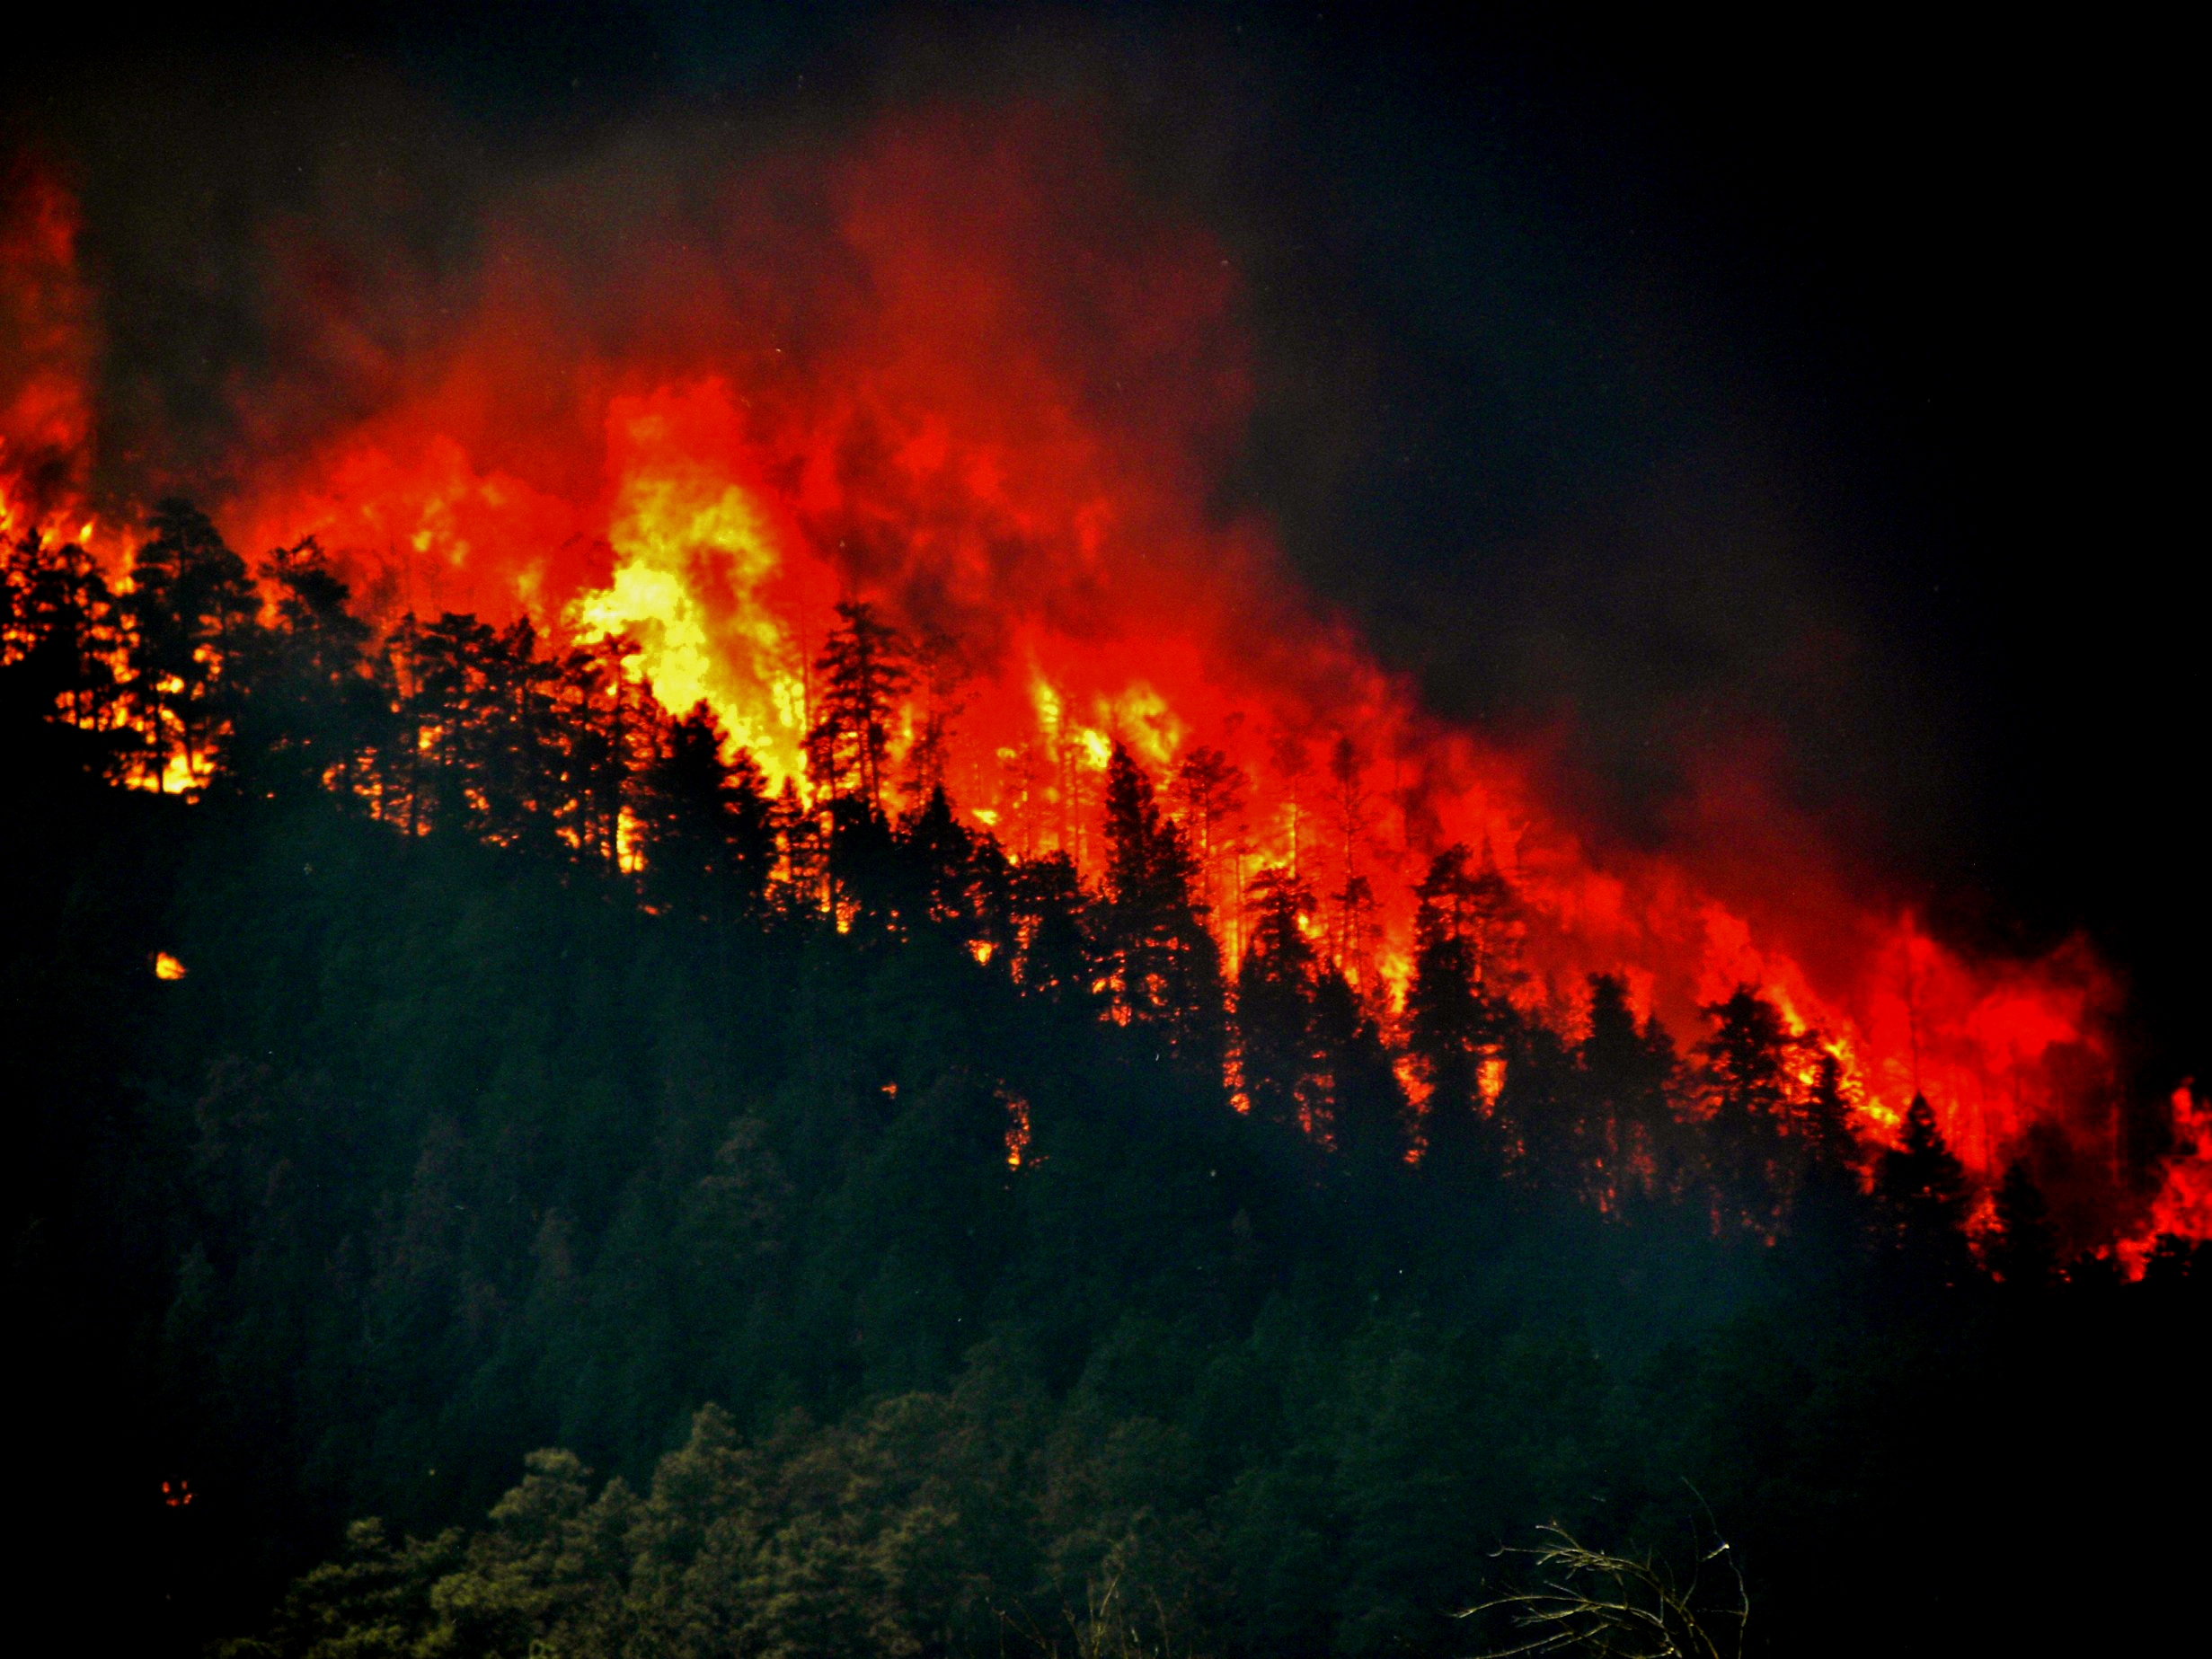
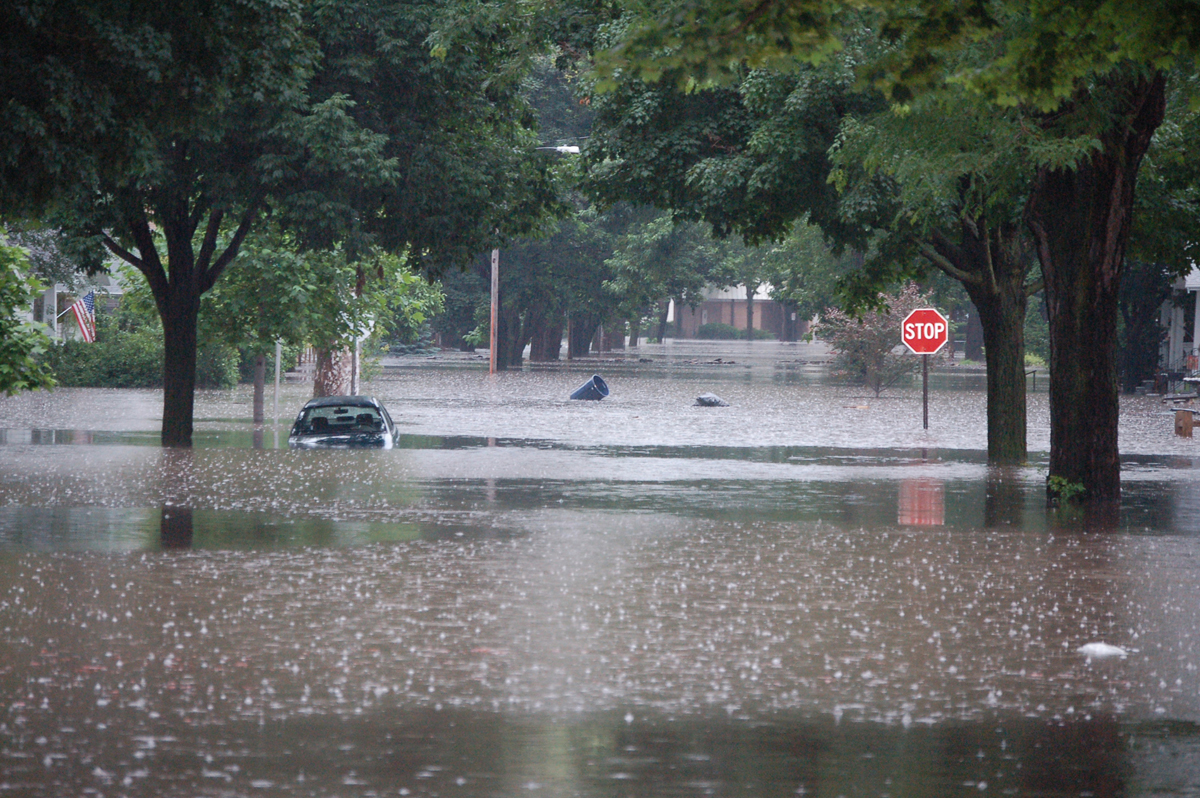
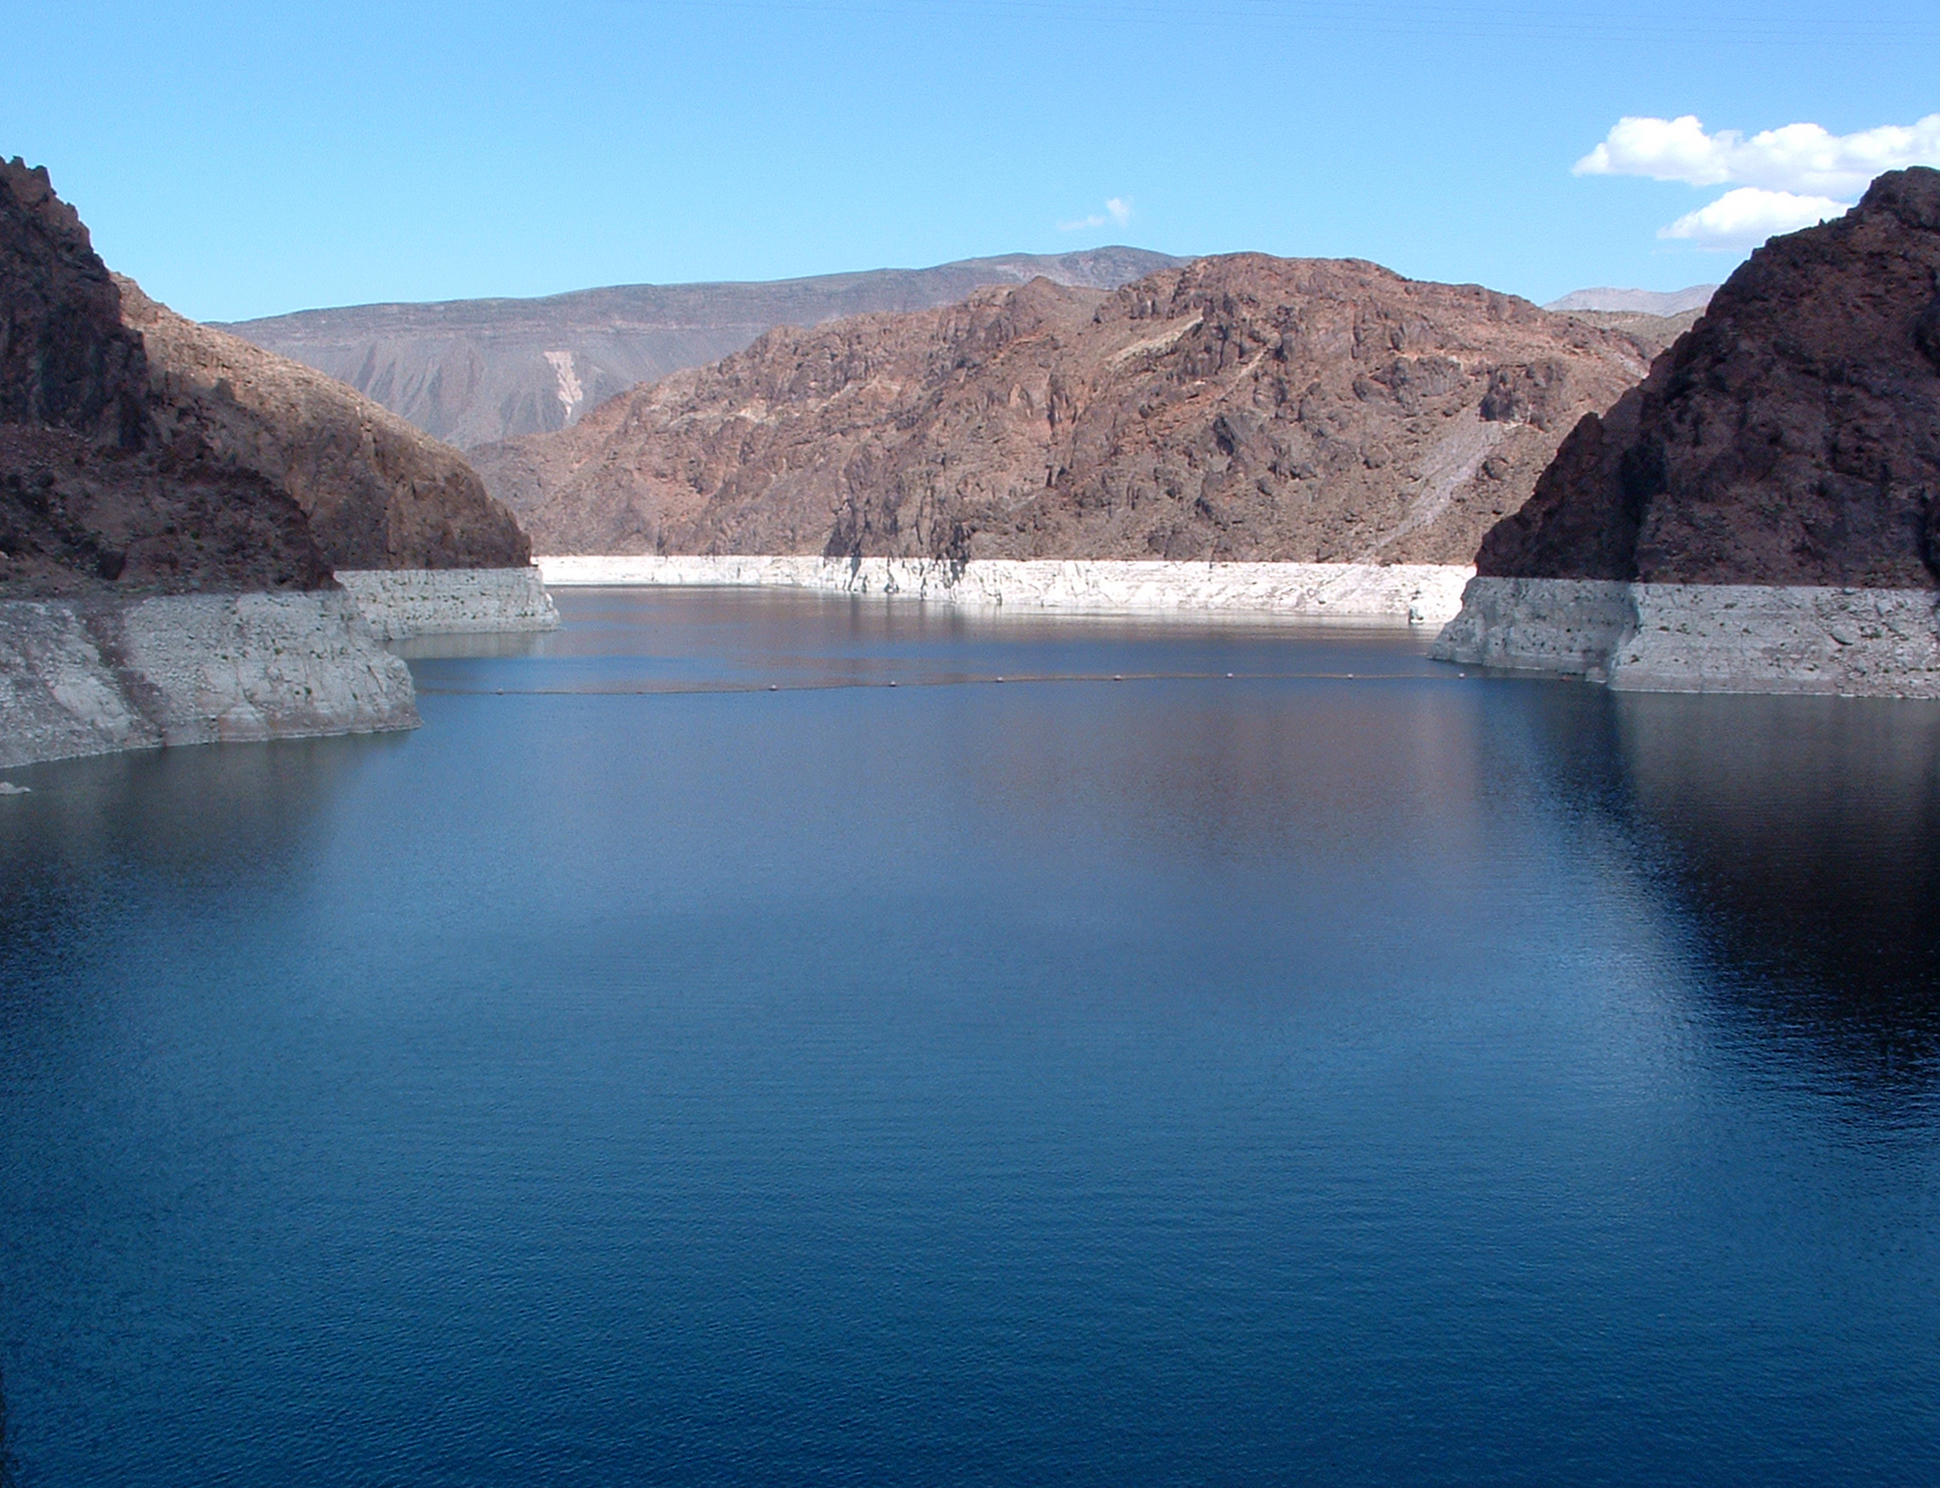
It’s not a minute too soon. At a time when Americans are battling drought, wildfires, flooding, heatwaves so intense that roads are melting, climate policy has grown urgent. And costly. The insurance industry reports costs of $39 billion in climate-related damage in the first half of 2022; that’s up from $31 billion just a year ago. Germany is turning off hot water in public taps, and all of Europe is bracing for a winter without Russian energy. The UK announced sea-level rise increased faster and more than expected. Nations, and regions, must work together to share energy resources and transitions.

The Manhattan Project marshaled the cooperation and resources of a nation. Image: “Manhattan Project Map” by Liandrei, 2011. Creative commons 3.0. Included with appreciation.

Americans have risen to the challenge of urgent energy response before. The Manhattan Project, spurred by fear of disaster and damage yet unknown to humankind, marshaled the resources of a nation. The result was a new form of energy.  The Clean Air Act of 1990 was the last big American environmental legislation: this will top that, bringing a plethora of incentives, subsidies and taxes. Some environmentalists lament one provision allowing drilling on 2 million acres of public land and 60 million acres of offshore seabed before use for renewable energy. While there are EV credits, the bill lacks similar encouragement for bikes, especially ebikes, knocking off an earlier credit of $900 in the earlier plan.

Here are some bill provisions, still pending passage:

POWER PLANTS – tax credits for zero-carbon power including battery, geothermal, nuclear, solar, wind.

CARBON SEQUESTRATION – tax credits for carbon capture.

EV – Buy a new electric car and get $7,500 off; buy a used Ev and get $4,000 off.

ENERGY EFFICIENT HOMES – the bill allocates $9billion for new energy-saving appliances, solar roofs, new air conditioning, heat pumps.

CLEAN MANUFACTURING –  for domestic production of batteries, or key minerals like lithium, solar panels, or wind turbines, there is $60 billion waiting, plus an additional $500 million to assist with heat pumps and key minerals.

METHANE MITIGATION – plugging leaks from gas and oil wells, pipelines is key to stopping methane, a greenhouse gas more potent than carbon dioxide. This provision works by penalty – $900 per metric ton of emissions over federal limits by 2024, moving to $1,500 in 2026. On the plus side, $20 billion for farmers to reduce cow burps and agricultural gases.

DOING GOOD IN THE NEIGHBORHOOD – $60 billion for communities unfairly burdened by climate change.

In November 2022, the world will reconvene for COP 27 to report climate action steps. If passed into law, this new agreement will advance climate response for the United helping to achieve United Nations Sustainable Development Goal #13 – Climate Action.

United Nations Sustainable Development Goal – CLIMATE ACTION. Image: United Nations, 2016. Wikimedia public domain. Included with appreciation.

Environmental Protection Agency, United States (EPA). “Clean Air Act.” 1990. https://www.epa.gov/clean-air-act-overview/clean-air-act-text

Nilsen, Ella. “Clean energy package would be biggest legislative climate investment in US history.” 28 July 2022. CNN.com. https://www.cnn.com/2022/07/28/politics/climate-deal-joe-manchin/index.html

Shao, Elena and Brad Plumer. “Seven Key Provisions in the Climate Deal.” 28 July 2022. The New York Times. https://www.nytimes.com/2022/07/28/climate/biden-climate-deal-key-provisions.html?referringSource=articleShare

Zipper, David. “There’s a maddening omission in the Senate Climate Bill: Congressional Democrats cannot imagine a world in which fewer people drive cars.” 29 July 2022. Slate.com. https://slate.com/business/2022/07/climate-bill-manchin-schumer-senate-ebikes-evs-cars.html

Building the World Blog by Kathleen Lusk Brooke and Zoe G. Quinn is licensed under a Creative Commons Attribution-NonCommercial-NoDerivs 3.0 Un

TRANSPORT: Heat melts airport runway

“Aircraft landing at Zurich International Airport” by Kuhnmi_DSC-3711.2, 2014. Creative Commons license 2.0, wikimedia. Included with appreciaiton.

Airline woes have lately taken a toll on passengers, crew, aircraft maintenance, and profits. But during this week’s heat wave, an airport runway melted. When London, England, UK suffered a temperature rise to 40 Celsius (104 Fahrenheit), Luton airport had to suspend flights to repair a runway damaged by intense heat. Transport infrastructure is made of materials susceptible to heat. Roads buckle, and airport runways are specialized roads.

“Hammersmith Bridge, 1827.” Original drawing scanned by Project Gutenberg. Public Domain, wikimedia. Included with appreciation.

Bridges are also vulnerable. City of famed London Bridge saw some structures falling down. Hammersmith Bridge was wrapped, Cristo style, in a cooling material designed to reflect sunlight away. The temperature control system, costing about half-million dollars (420,000 Pounds), is designed to keep the 135-year-old bridge from melting and placing an untenable load on its support pedestals that are made of cast-iron, also vulnerable to heat.

“Three Rail Tracks” by photographer G-Man, 2003. Dedicated to the public domain. Wikimedia. Included with appreciation.

Railways become hot grids when sunlight sears the rails. With the high ambient temperatures combining with sun rays on the rails, the heat reaches 48 Celsius (118 Fahrenheit). The solution? Painting the rails white.

Wildfires cause damage to people, animals, plants, and also to the atmosphere. “Carbon Monoxide from Amazon Wildfires in 2019.” NASA/JPL-Caltech. Public Domain. Included with appreciation.

In Europe and the UK, heat is causing wildfires: 27,000 acres scorched in southwestern France, causing 32,000 people to leave their homes. Spain’s wildfires caused the state railway to suspend service; in Portugal, one person died every 40 minutes between July 7-13. In the United States, over 100 million people are sweltering in record-breaking heat. In China, heat melted the roof of the museum housing cultural treasures of the ancient Forbidden City. Sadly, each season brings the same dangers and the same warning: according to World Weather Attribution (WWA), the 2021 heat wave was “virtually impossible without human-caused climate change.” In addition to human and natural resources suffering, heat waves damage economies: projected economic impacts in Europe by 2060 are expected to increase five-fold (García-León 2021).

“How a heat wave forms.” by U.S. weather.gov. Public Domain. Wikimedia Commons. With appreciation.

Bad as that news is, it is also an indication of the potential savings – in human, natural, and economic resources – of innovations that can halt and reverse climate change – and also innovations in materials more suitable to a warming world. Even with climate goals met, warming will continue for some decades. Aging transport infrastructure is due for rebuilding: bridges, roads, and runways need an upgrade. What kinds of materials can be developed for a changing climate?

García-León, David, et al., “Current and projected regional economic impacts of heatwaves in Europe.” Nat Commun 12, 5807 (2021). https://doi.org/10.1038/s41467-021-26050-z

Hammersmith & Fulham Council. “Keeping Hammersmith Bridge cool- and open – in the heatwave.” 13 July 2022. https://www.lbhf.gov.uk/articles/news/2022/07/keeping-hammersmith-bridge-cool-and-open-heatwave

National Weather Service, NOAA. “WetBulb Globe Temperature.” https://www.weather.gov/tsa/wbgt

Vera, Amir. “It’s so hot, roads are buckling, they’re putting foil on a bridge, and roofs are melting around the world.” 22 July 2022. CNN. https://www.cnn.com/2022/07/21/weather/global-infrastructure-its-so-hot-extreme-heat/index.html

World Weather Attribution (WWA). “Western North American extreme heat virtually impossible without human-caused climate change.” 7 July 2021. https://www.worldweatherattribution.org/western-north-american-extreme-heat-virtually-impossible-without-human-caused-climate-change/

Building the World Blog by Kathleen Lusk Brooke and Zoe G. Quinn is licensed under a Creative Commons Attribution-NonCommercial-NoDerivs 3.0 Un


WATER: Mapping YOUR Climate Risk

What is your climate risk? Animation created by SaVi software from Geometry Center, University of Minnesota by Grand DixenceWikipedia for view of Iridium coverage. Image animation edicated to the public domain (CC1.0) by its creator, and included here with appreciation.

Climate change brings risk. For some, it is water: floods, storms, and sea-rise. For others, it is drought: water shortages, crop losses, and wildfires. Floods killed 920 people in Belgium and Germany, 192 in India, 113 in Afghanistan, and 99 in China – in one month (July) of 2021. Deaths from floods and related landslides took the lives of people in Bangladesh, Japan, Nepal, Pakistan, and Yemen that same year. (Davies 2021)

“Flooding in Cedar Rapids, Iowa, USA.” Photographed by Don Becker, USGS, 2008. Dedicated to the public domain (CC1.0) by United States Geological Survey and included here with appreciation.

Previous data from weather sources tracked flood risk, resulting in flood insurance for many properties (and denial of such insurance for locations too vulnerable to merit rebuilding). Water damage will only increase with climate warming, as storms grow more powerful. Rising sea levels will escalate floods and coastal inundations. Those who live in the territories of the Colorado River know well another risk related to water: drought. Water scarcity has ravaged crops, parched residential landscapes, reduced drinking water supplies, and now threatens hydropower created by the Hoover Dam. Australia, the most arid continent on Earth, is vulnerable crop loss, and electricity reduction in facilities like Snowy Mountains Hydroelectric Power.

California Fires in 2021. “Erber Fire in Thousand Oaks,” by Venture County Fire Department Public Information Office. Dedicated to the public domain (CC1.0) and included here with appreciation.

Drought also brings another danger: wild fire. Fire risk is growing with climate warming. In 1980, fire damage in the United States tallied $10 billion; in 2021, costs reached $300 billion. Worldwide, fire affects 1.5 million square miles (four million square kilometers) of Earth – each year. To picture that, the area would measure one-half of the continental United States, or more than the entirety of India. Using data from satellites like the Copernicus Sentinel-3, and the European Space Agency (ESA). the Centre for Research on the Epidemiology of Disasters tracked 470 wildfire disasters (incidents affecting more than 100 people) since 1911, totaling $120 billion in damages. The 2021 Dixie Fire in California devoured 626,751 acres (253,647 hectares); that same year, in Siberia, wildfires destroyed 3.7 million acres (1.5 million hectares) to become the largest wildfire in documented history. In 2022, the Calf Canyon-Hermits Peak fire in New Mexico continues burning over 270,00 acres and is still (at this writing) only 29% contained. The cumulonimbus flammagenitus cloud ( or CbFg or pyroCb) from the fire could be seen from space on NASA’s Aqua satellite via MODIS.

What’s your property’s climate risk? Photography by Antan0, 2010. Image of magnifying glass. CC4.0; included here with appreciation.

Would you like to know what the future looks like in your area? Now, a new mapping technology from the First Street Foundation can help you determine your risk. If you live in the United States, enter your street address, or your zip code, and you will see if you are one of 30 million properties vulnerable to flooding or wildfire. To assess your own property’s risk, click here.

Aqua Mission. Earth Observing System, NASA. https://aqua.nasa.gov/content/aqua-earth-observing-satellite-mission

Centre for Research on the Epidemiology of Disasters. https://www.cred.be

Copernicus Sentinel-3. “Measuring Earth’s oceans, land, ice, and atmosphere to monitor and understand global dynamics.” European Space Agency (ESA). https://www.esa.int/Applications/Observing_the_Earth/Copernicus/Sentinel-3

Davies, Richard. “Worldwide – Over 920 People Killed in Floods and Landslides in July 2021.” 2 August 2021. Floodlist. https://floodlist.com/asia/world-floods-july-2021

First Street Foundation. “Make climate risk accessible, easy to understand, and actionable for individuals, governments, and industry.” https://firststreet.org/mission/

Haddad, Mohammed and Mohammed Hussein. “Mapping Wildfires around the World.” 19 August 2021. Al Jazeera. https://www.aljazeera.com/news/2021/8/19/mapping-wildfires-around-the-world-interactive

Risk Factor. “A property’s flood or fire factor.” https://riskfactor.com

Building the World Blog by Kathleen Lusk Brooke and Zoe G. Quinn is licensed under a Creative Commons Attribution-NonCommercial-NoDerivs 3.0 Un


CITIES: No Mow May

NO MOW MAY. This month, let your lawn grow with wildflowers to feed seasonal pollinators like bees. Photo: “Wildflowers” by Richard Croft, 2007. Wikimedia CC 2.0. Included with appreciation.

Public parks like Boston’s Greenway or New York City’s Central Park might be the lungs of the city, but urban and suburban yards may be the pop-up restaurants for seasonal pollinators like bees that will help the world through climate change. American lawns occupy 40 million acres, and may be the largest irrigated “crop” in the United States – three times more than irrigated corn. (Milesi, University of Montana and NOAA National Geophysical Data Center)

“Automaton Lawn Mower by Ransomes, Sims & Jeffries of Ipswich, England,” advertisement circa 1867. Public Domain.

No Mow May is an organization in the United Kingdom advocating the absence of lawn mowing, letting lawns grow wild, for this month, offering a spring habitat and feeding ground of wildflowers and clover critical for emerging bees and early pollinators. In addition to homes, colleges are included: Lawrence University recently joined the organization Bee City, USA, and its affiliate: Bee Campus USA.

Fewer lawns, more bees. “Abeille” by Jean-Raphaël Guillaumin, 2010. Wikimedia, CC 2.0. Included with appreciation.

Yards, and campuses, participating in No Mow May noted three times more bee species abundance and five times more bee attendance than in lawn areas.

Another benefit of No Mow May? Water retention. People water lawns. In an era of drought and water scarcity, lawns may be phased out. That what happened in Las Vegas, Nevada.

Lake Mead, water reservoir of the Colorado River, supplies Las Vegas with water. A new law by the Southern Nevada Water Authority prohibits lawns, and watering of nonfunctional turf, in response to drought conditions on the Colorado River. Image: “Lake Mead” by Kjkolb, public domain. Included with appreciation.

A new law, related to water shortages in the Colorado River, enacted by the Southern Nevada Water Authority, decreed first-ever permanent prohibition of non-functional turf (soccer fields are functional, household lawns are not). Residents are digging up grass and replacing it with rocks and cactus, creating xeriscapes, a kind of landscaping reducing or eliminating need for irrigation.

Do you have grass in your yard or on your campus? Participate in No Mow May: for a printable yard sign, click here

Bee City USA. https://beecityusa.org

Bee Campus USA. https://beecityusa.org/current-bee-campus-use-affiliates

Del Toro, Israel and Relena R. Ribbons. “No Mow May lawns have higher pollinator richness and abundances: An engaged community provides floral resources for pollinators” 22 September 2020. National Library of Medicine: National Center for Biotechnology Information. doi: 10.7717/peerj.10021

Milesi, Cristina. “More Lawns than Irrigated Corn.” 8 November 2005. Earth Observatory, NASA.gov. https://earthobservatory.nasa.gov/features/Law/lawn2.php

No Mow May. Plantlife.  https://www.plantlife.org.uk

Osann, Ed. “Toward Sustainable Landscapes: Restoring the Right NOT to Mow.” 6 May 2016. Natural Resources Defense Council. https://www.nrdc.org/resources/toward-sustainable-landscapes-restoring-right-not-mow

Southern Nevada Water Authority. “An Act relating to water; prohibiting, with certain exceptions, the use of water from the Colorado River to irrigate nonfunctional turf on certain properties.” Assembly Bill No. 356, 22 March 2021. https://www.leg.state.nv.us/Session/81st2021/Bills/AB/AB356_R1.pdf

Building the World Blog by Kathleen Lusk Brooke and Zoe G. Quinn is licensed under a Creative Commons Attribution-NonCommercial-NoDerivs 3.0 Un


WATER: Noah’s Ark for Marine Life

“Noah’s Ark,” by Edward Hicks. Philadelphia Museum of Art. Public Domain, USA. Image: wikimedia

Coral reefs cover just 1% of the ocean floor but support 25% of all marine life. According to The Ocean Agency’s founder Richard Vevers, even if we meet the targets of the Paris Agreement, we may lose 90% of our coral reefs by mid-century due to ocean warming and acidification that causing coral reef bleaching. Working with the Centre for Excellence in Environmental Decisions at the University of Queensland, The Ocean Agency and a team of scientists selected 50 coral reefs that are most likely to survive climate change with a little help. The reefs chosen are a sample “large enough to allow protection of reefs in all major regions” (UQ 2017).

“Coral planting and reef restoration,” by Profmauri, 2011. Creative Commons 3.0, wikimedia.

Given this ‘Noah’s Ark’ for coral and marine life, how can this precious resource be preserved? Much like the examples of humans helping Nature as in the National Trails System, Roman Aqueducts or the New River, natural coral reefs may get a boost from engineering innovations. Coral can be grown in a lab, where growth that could take 100 years in the ocean can be accomplished in two years under laboratory conditions. Once the tiny corals are ready for transplanting, they can be placed on reefs that are suffering but still able to recover; it’s a process known as “reskinning.”

“The Silent Evolution” by James deCaires Taylor. Photographer, allenran 917, 2014. Creative Commons 2.0.

Another option: forming new coral reefs using underwater sculptures like those created by James deCaires Taylor for the Australia’s Museum of Underwater Art on Great Barrier Reef, and Mexico’s Mesoamerican Reef, largest in the Western Hemisphere, for the Museo Subacuático de Arte. Some debate whether such sculptures are helping or harming marine life. Similar underwater sculpture gardens created by Angeline Chen and Kyle Block, founders of Global Coralition, are located in Koh Tao, Thailand, and in the Dominican Republic, where art honors the traditional water deities of the Arawak/Taino cultures of the Caribbean.

“Blue Spotted Stingray in Koh Tao, Thailand coral reef,” photographer Jan Derk, 2004. Generously dedicated to the public domain by Jan Derk. Creative Commons. With appreciation to Jan Derk.

Vevers worried that coral is an emergency that is invisible to all but divers and the denizens of the ocean. To make the invisible visible (coincidentally the theme for World Water Day 2022 referencing groundwater), The Ocean Agency reached out to Jeff Orlowski and Larissa Rhodes to collaborate on a Netflix film: “Chasing Coral.” During filming, the most dangerous coral bleaching event in history occurred. The film debuted at Sundance and has helped to make coral’s plight more accessible. Watch the film here.

“Coral reef locations,” by NASA, 2006, from Millennium Coral Reef Landsat Archive. Public Domain. 50 are chosen for “Noah’s Ark” preservation. For information on each reef, visit http://seawifs.gsfc.nasa.gov/landsat.pl

Art may help to raise awareness, and respect, for the world’s coral reefs. In addition to nurturing 25% of marine life, coral provides 1 billion people with food, jobs, and income that generates $375 billion in economic benefits. Coral reels are not visible to most of us, so they may be out of mind. But there is much each of us can do. Recycling plastic that can harm reels and marine life, being cautious about the use of some sunscreens when enjoying the beach, or by supporting ocean sustainability and coral reef regeneration, we have an opportunity to build a modern-day Noah’s Ark for coral.

Beyer, Hawthorne L, et al., “Risk-sensitive planning for conserving coral reefs under rapid climate change.” 27 June 2018. Conservation Letters, Volume 11, Issue 6, e12587. https://doi.org/10.1111/conl.12587

DeCaires, Jason Taylor. “An underwater art museum, teeming with life.” TED talk. December 2015. https://www.ted.com/talks/jason_decaires_taylor_an_underwater_art_museum_teeming_with_life?language-en

Drury, Madeleine. “Are giant underwater sculptures helping or harming marine life?” 07/09/2021. Euronews.com. https://www.euronews.com/green/2021/o7/13/are-giant-underwater-sculptures-helping-or-harming-marine-life

Global Coralition. https://www.globalcoralition.org

Netflix and Exposure Labs: “Chasing Coral,” Film. https://www.youtube.com/watch?v=aGGBGcjdjXA

The Ocean Agency, “50 Reefs.” Video: https://youtu.be/pFfVpO_q4sg

University of Queensland, Global Change Institute. “Which reefs are the most important to save?” 24 February 217. https://www.uq.edu.au/news/article/2017/02/which-reefs-are-most-important-save

Vevers, Richard. “Interview,” https://youtu.be/8hMAgr4p7Sg

Wilson, Amy. “Microfragmentation: a breakthrough for coral reef restoration.” 18 September 2018. Medium.com. https://medium.com/@amykwilson/microfragmentation-a-breakthrough-for-coral-reef-restoration-6a2e86c4e2

Building the World Blog by Kathleen Lusk Brooke and Zoe G. Quinn is licensed under a Creative Commons Attribution-NonCommercial-NoDerivs 3.0 Un

TRANSPORT: Ten Mile Markers on the Road to the Future

Ten Mile Markers to the Future. Image” Numbers 1 to 10 Rotation Illusion” by Nevit Dilmen, 2012. Wikimedia: Creative Commons 3.0. Included with appreciation .

Many governments, and most scientists, are clear that we need to stop using fossil fuels to halt climate change (and perhaps geopolitical conflict). But transitioning from today’s energy sources and systems to a new energy paradigm is not as clear. Where and how to start?

“500 Series Shinkansen train at Tokyo Station,” 2005. Photographer ⊃ Wikimedia: CC 3.0. With appreciation.

Let’s start with transport, because it is a sector already altered by the recent viral pandemic. Can we preserve some of the energy-saving practices as we move into the future? Here are ten steps recommended by the International Energy Agency:

TEN MILE MARKERS ON THE ROAD TO THE FUTURE

REDUCE SPEED: cut speed limit on highways by 10 kilometers (6.2 miles) per hour

TELECOMMUTE: work from home 3 days per week if possible

CAR-FREE DAY: large cities could ban cars from central urban roads one day per week

MICRO MOBILE: build bikeways, skating lanes, and walking paths

CAR SHARE: take an Uber; get a Lyft; commute with buddies

DELIVER THE GOODS: redesign freight trucks and trains for better energy use

EV: accelerate use of electric vehicles by financial incentives and supportive infrastructure

ZOOM: cut all non-essential business travel in favor of teleconferencing

TRAIN: incentivize high-speed, maglev, and hyper-loop trains with overnight sleeper cars

If the above actions were achieved, “Full implementation of these measures in advanced economies alone can cut oil demand by 2.7 million barrels a day within the next four months.” (IEA 2022)

Logo of International Energy Agency. www.iea.org. Image: wikimedia. With appreciation to IEA.

The International Energy Agency was founded (November 1974) to set up a collective action system to respond to disruptions in energy (then, mainly oil) supply. The IEA was created with a treaty: “Agreement on an International Energy Program.” Today, the IEA represents 75% of global energy consumers.

Can highways change energy use? “Car dashboard on highway,” by Arkady Lifshits, photographer. Generously dedicated to the public domain. Wikimedia: Creative Commons 1.0. With appreciation.

While the IEA can act collectively (It did in 1991, 2005, and 2011: could there be another soon?), countries often set energy-saving policies during shortages. In 1973, the United States Federal Highway Interstate System reduced speed limits to 55 mph (89 km/h) by passing the National Maximum Speed Law. As a result, lives were saved as well as energy: road fatalities declined by 16% (Friedman 2009).

England’s New River has walking paths. “New River Bowes Park,” by Nick Cooper, 2009. Creative Commons 3.0 with appreciation.

Walking paths were installed alongside England’s New River in 1603. Japan’s high-speed rail system, Shinkansen, (see above) built for the Tokyo Olympics in 1964 (and upgraded for the recent Summer Olympics in 2021), was profitable from day one.

“Eurotunnel: Folkestone Terminal,” by Ed Clayton, 2012. Creative Commons 2.0. With appreciation.

The Channel Tunnel, providing train transit from London to Paris, has brought increased economic and environmental benefits. Every new form of transport has caused changes in civilization: from the Silk Road to the Lunar Landing. Transport has the opportunity, and perhaps obligation, to develop mile makers on the road to the future. 


Buttigieg, Pete, United States Secretary of Transportation, and Cristiano Amon, President and CEO of Qualcomm. “The Future of Transportation is Driven by Tech.” CES 2022. VIDEO: https://www.youtube.com/watch?v=59HgM5gwmFI

Friedman, Lee S. el al., “Long-Term Effects of Repealing the National Maximum Speed Limit in the United States.” September 2009. American Journal of Public Health: 99(9): 1626-1631. https://www.ncbi.nlm.gov/pmc/articles/PM2724439/ and doi: 10.2015/AJPH.2008.153726

International Energy Agency (IEA). “A 10 Point Plan to Cut Oil Use.” March 2022. https://www.iea.org/reports/a/10-point-plan-to-cut-oil-use

United Nations. “Agreement on an International Energy Program (with annex).” and “Accord relatif à un programme international de l’énergie (avec annexe).” Number: 15664, 18 November 1974. https://treaties.un.org/doc/Publication/UNTS/Volume%201040/volume-1040-A-15664-English.pdf

United States. “National Maximum Speed Limit (NMSL)” as part of the “Emergency Highway Energy Conservation Act.” Public Law 93-239 – Jan. 2, 1974. https://www.govinfo.gov/content/pkg/STATUTE-87/pdf/STATUTE-87-Pg1046.pdf

Building the World Blog by Kathleen Lusk Brooke and Zoe G. Quinn is licensed under a Creative Commons Attribution-NonCommercial-NoDerivs 3.0 Un


WATER: Jason and the Return of the Argonauts

“Argo Temperature/Salinity Float Network” by Dmcdevit, 2007 for Global Warming Art. License GNU Free 1.2. Image: wikimedia.

Recent tornadoes, storms, floods caused loss of life and damage of property. While warmer temperatures are known to fuel and intensify tornadoes, scientists are uncertain if tornadoes that swept across four U.S. states were caused by climate change. What is certain is unseen, but even more troubling. Antarctic currents are changing. The above NASA illustration shows the movement of ocean currents including the Antarctic Circumpolar Current:  at 1,200 miles (1,931 kilometers) wide and two miles (3 kilometers) deep, it is the globe’s largest current. Its motion draws the deepest water from the Atlantic, Indian, and Pacific oceans to swirl it to the surface. In the process, the water exchanges heat and carbon dioxide with the atmosphere. It’s called an upwelling.

“Upwelling” in an animation by NOAA. Image: public domain, wikimedia.

With a warming world, upwelling may release more carbon dioxide that had formerly been sequestered in the blue deep of the oceans. Oceans have sequestered 25% of carbon dioxide and 90% of excess heat from burning fossil fuels. What if that were to change? Moreover, the warming upwelling waters that travel through and beneath Antarctic are melting ice shelves like those near the Thwaites glacier. If those ice sheets melt into the ocean, sea rise could advance by as much as 12 feet (3.66 meters). Ice sheets act as a blockade, protecting glaciers: if that blockade breaks, glaciers will also melt more quickly and release even more water to rising seas. (Fountain and White, 2021) Watch a video about the Thwaites glacier here.

“Thwaits Glacier.” NASA, 2014. Public domain, wikimedia.

What can be done? Gathering more data is a first step. Robotic autonomous floats called ‘Argo Floats‘ are a small army of 3900 presently bobbing in the world’s oceans, sending back data. When below water for their ten-day shift, Argo Floats gather data; when they pop up to the surface, they transmit. The National Oceanic and Atmospheric Administration (NOAA)  and the Global Ocean Monitoring and Observing (GOMO) program is named after the mythical Jason and the Argonauts who sailed to find the Golden Fleece.

“Scenes from the Story of the Argonauts” by Biagio d’Antonio, circa 1472-1516. From the Metropolitan Museum of Art, donated to wikimedia for public domain open access use.

Jason and the Argonauts may be one of the oldest myths of a hero’s quest. The present initiative references not only the ancient Greek myth, but also the ocean mission. The title also indicates its complementary relationship with the Jason satellite altimeters that study the situation from above. The instruments called ‘Argo Floats:’ the measurements of sea surface height are termed ‘Jason measurements’ that report temperature and salinity. (Brown 2019). In 2020, Antarctica observed a 200-year anniversary. Polar regions are among the most important places for climate change, due to a process termed polar amplification. The Antarctic Treaty, signed in 1959, offers some protections, but the ban on mining of Antarctic minerals expires in 2048. If or when the Antarctic Treaty is revised, what provisions should be upheld, changed, or added?

Argo Program. NOAA. https://globalocean,noaa.gov/Research/Argo-Program

Brown, Fiona “What we learnt from spending winter under the Antarctic sea ice.” 15 May 2019. CSIROscope. https://blog.csiro.au/

Fountain, Henry and Jeremy White. “Rising from the Antarctic, a Climate Alarm.” 14 December 2021. New York Times. https://www.nytimes.com/interactive/2021/12/13/climate/antartic-climate-change.html?referringSource=articleShare

Institute for Marine and Antarctic Studies (IMAS). “Geoengineering The Southern Ocean? A Transdisciplinary Assessment.” University of Tasmania, Australia. https://www.imas.utas.edu.au/home/home-features/arc-laureate-fellowship-geoengineering-the-southern-ocean-a-transdisciplinary-assessment

Jason satellite program mission. NOAA. https://sealevel.jpl.nasa.gov/missions/jason-1/summary

Ramirez, Rachel. “Scientists warn a critical ice shelf in Antarctica could shatter within five years.” 14 December 2021. CNN. https://www.cnn.com/2021/12/14/world/antarctic-thwaites-glacier-climate-warming/index.html

Silvano, Alesandro et al., “Seasonability of warm water intrusions onto the continental shelf near the Totten Glacier.” 3 May 2019. Journal of Geophysical Research: Oceans/Volume 124, issue 6, pages 4272-4289. https://doi.org/10.1029/2018JC014634 and https://agupubs.onlinelibrary.wiley.com/doi/full/10.1029/2018JC014634

Building the World Blog by Kathleen Lusk Brooke and Zoe G. Quinn is licensed under a Creative Commons Attribution-NonCommercial-NoDerivs 3.0 Un


WATER: Foreseeing the Future

New Orleans in 1803. Image: “Under My Wings Everything Prospers” by J. L. Bouqueto de Woiseri. 1 January 1803. Public Domain. Image: wikimedia commons.

Hurricane Ida hit Louisiana, in August 2021, bringing severe wind and water. New Orleans was watching. After Hurricane Katrina, in 2005, the city built a flood-prevention system of gates, levees, pumps, and walls. Sixteen years later, almost to the day, Ida tested Katrina’s resilient infrastructure. The city emerged relatively unscathed( Hughes, 2021). But just 60 miles away, storm surge toppled the Lafourche Parish levee. Overwhelmed by floods, damaged sanitation and sewage systems threatened public health. The discrepancy between a prepared city and an unprotected town foretells the future of coastal communities in climate change.

Hurricane Katrina in 2005 caused damage that resulted in the building of a storm protection system, tested by Hurricane Ida in 2021. Image: “Hurricane Katrina, 28 August, 2005” from NOAA. Public Domain.

It’s not just flooding. Even though New Orleans avoided Katrina’s flooding in Ida, there were other dire effects. Like power outages. Hundreds of thousands of people remained without electricity a week after the storm. Refrigerators were off, so were air-conditioners: in the 90 degree (F) heat, the situation was dangerous. Those who could escaped to nearby places with electricity for an “evacuation vacation.” Many were not so fortunate.

“Hurricane Ida at Landfall in Port Fourchon, Louisiana, 29 August 2021. Image: weather.gov. Public Domain.

Coastal communities face an uncertain yet certain future. By 2040, providing storm-surge systems like sea walls for American cities with populations greater than 25,000 is estimated to cost $42 billion – that would include New Orleans. But what about Lafourche Parish? Protecting smaller communities and towns would raise the cost to $400 billion. (Flavelle 2021). Protecting against flooding is only part of the problem, however: wind damage to above-ground electrical poles, wires, and transformers is cause for alarm. During Hurricane Ida, 902,000 customers lost power when 22,000 power poles; 26,000 spans of wire, and 5,261 transformers were damaged or lost – more than Katrina, Zeta, and Delta combined (Hauck 2021).

“Map illustrating areas of the Netherlands below sea level.” By Jan Arkestejin. Pubic Domain Image: wikimedia.

Even with abundant funding, infrastructure takes time to build. Storms, however, will not stop. While rebuilding more resilient storm barrier and electrical systems, communities may look to the Protective Dikes and Land Reclamation practices of The Netherlands as a case example of immediate resilient response. The Dike Army (Dycken Waren), composed of residents responding together in times of need, was part of the system. As Louisiana, and other areas significantly damaged by Hurricane Ida, consider how to rebuild, it may be time to call to arms a new kind of Dike Army, perhaps a regional Civilian Climate Conservation Corps (4C), to serve and protect coastal communities and habitats: both terrestrial and marine. Disaster response would be in addition to the goals of the Civilian Climate Corps proposal of the US in January 2021. The 4C’s motto is up for a vote: some want “For Sea” and some like “Foresee.” What’s your vote?

“CCC” pillow from CCC museum in Michigan, USA. Image: public domain.

Flavelle, Christopher. “With More Storms and Rising Seas, Which U.S. Cities Should Be Saved First?” 19 June 2019. The New York Times.

Hauck, Grace. “Week after Hurricane Ida’s landfall, hundreds of thousands still without power.” 5 September 2021. USA TODAY. https://wwwusatoday.com/story/news/nation/2021/09/05/hurricane-ida-louisiana-residents-without-power-families-homeless/5740682001/

White House, Biden-Harris. “Civilian Climate Corps.” 27 January 2021. https://www.whitehouse.gov/briefing-room/statements-releases/2021/01/27/fact-sheet-president-biden-takes-executive-actions-to-tackle-the-climate-crisis-at-home-and-abroad-create-jobs-and-restore-scientific-integrity-across-federal-government/

Building the World Blog by Kathleen Lusk Brooke and Zoe G. Quinn is licensed under a Creative Commons Attribution-NonCommercial-NoDerivs 3.0 Unp

TRANSPORT: Linking the World

“Ancient Silk Road,” image: wikimedia commons.

The history of civilization may be measured by connection. First it was the Silk Road that connected cities; then it was the age of ships that created ports from Singapore to Suez.  Canals threaded connection through waterways, making one route from inland to sea: the Grand Canal, Canal des Deux Mers, Erie, Panama. Rail linked continents: the Trans-Continental, Canadian Pacific, and the Trans-Siberian united people across vast spans. But each of these achievements was a separate project.

“Belt and Road Initiative.” graphic design by Mathildem 16, 2020. Image: wikimedia.

BRI or B3W? Now, there are two plans to connect the world in a more comprehensive way: the “Belt and Road Initiative” (BRI) announced and begun in 2013 by China, and the “Build Back Better for the World” (B3W) proposed by the G7 in 2021. China is ahead: more than 100 countries have signed BRI agreements. Some comment that the BRI is able to move quickly from plan to construction of new ports linked to rail and road routes, and also express concern regarding resourcing: financial, human, and natural. But some say that the G7 could take inspiration from Charlemagne who united disparate groups through links of education, as well as land and sea. The G7’s B3W may include capital to fund areas like climate, digital technology, health security, as well as transport.

Will B3W make waves of change? “47th G7 2021 Waves Logo,” wikimedia commons.

Climate change will cause a new vision. It is certain that the world needs rebuilding: old bridges, ports, rail, and roads are in dire need of replacement, while new infrastructure could transform many places not yet linked. Some have cited the Marshall Plan as precedent to rebuilding and linking a new vision of the world. Others may see different possibilities that include contemporary concerns. As BRI and B3W consider terms of engagement and goals of success, is there an opportunity to link the world through the values of inclusion, peace, and sustainable resilience?  What is your vision of an interconnected world?

Ruta, Michele. “Three Opportunities and Three Risks of the Belt and Road Initiative.” 4 May 2018. World Bank Blog. https://blogs.worldbank.org/trade/three-opportunities-and-three-risks-belt-and-road-initiative

Sanger, Davi. E. and Mark Landler. “Biden Tries to Rally G7 Nations to Counter China’s Influence.” 12 June 2021. The New York Times. https://www.nytimes.com/2021/06/12/world/europe/biden-china-g7html?referringSource=articleShare

Building the World Blog by Kathleen Lusk Brooke and Zoe G. Quinn is licensed under a Creative Commons Attribution-NonCommercial-NoDerivs 3.0 Unp

ENERGY: 2020 by the Numbers

The year 2020 will go down in history for many reasons, including climate change. Temperatures were 1.08 degrees Fahrenheit (0.6 Celsius) warmer than the 1981-2010 average and 2.25 degrees Fahrenheit (1.25 Celsius) above pre-industrial times. Rising temperatures have consequences. In January of 2020, Australia suffered wildfires burning an area bigger than Florida. In summer, Atlantic hurricane season brought 30 named storms, carrying more water (warming oceans produce more water, higher waves, increased flooding). Western United States areas like California, Nevada, Oregon, Washington witnessed fires that destroyed 10.3 million acres. In the Arctic, data from the Copernicus Climate Change Service showed the region is warming faster than feared, more than twice the pace as the rest of the globe, with 5.4 degrees Fahrenheit (3 degrees Celsius). Environmental scientists noted that 2020 set a record for carbon dioxide concentrations, rising to 413 ppm (parts per million) in May of 2020, even with Covid-19 lockdowns. (Kann and Miller, 2021)

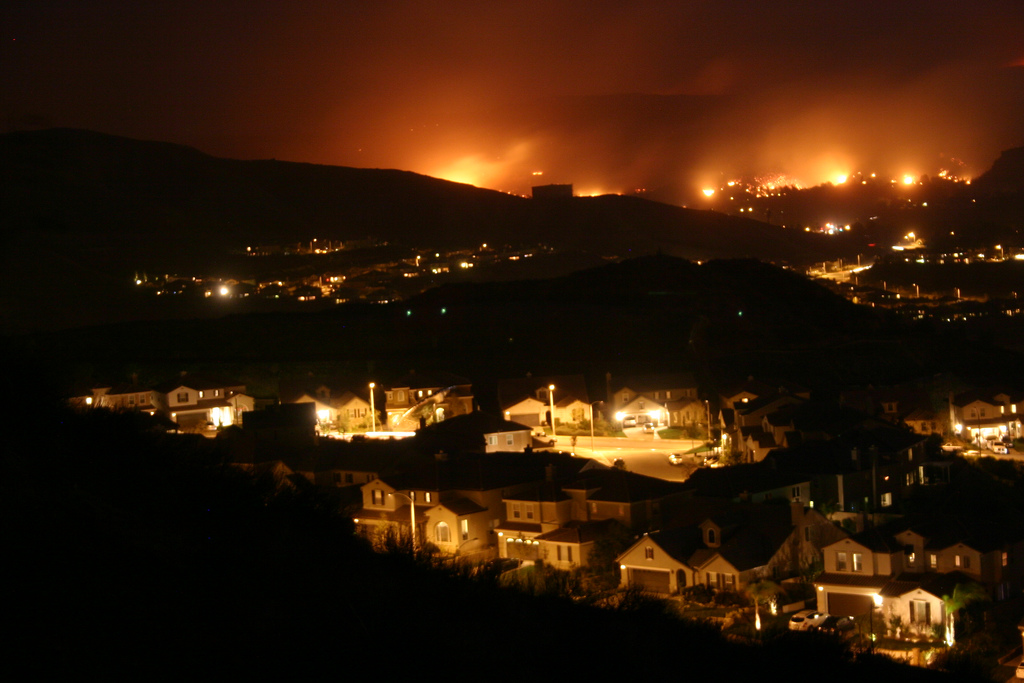
“Wildfire in Santa Clarita, California.” Image: wikimedia.

Price tag? $95 billion. And that’s just for U.S. climate-related damage, according to Munich Re, insurance company to other insurance firms that covered damage from Atlantic storms and California wildfires. Chief climate scientist of Munich Re Ernst Rauch warned that building in high-risk areas added to losses. Hurricanes  were significant in damage, causing $43 billion in losses. Convective storms (like hailstorms and tornadoes) caused $40 billion. Wildfires added up to $7 billion including destruction of crops, endangering food security. Residential and business properties sustained damage and claimed insurance losses, over 4000 properties in Oregon and many more in California. According to Donald L. Griffin of American Property Casualty Insurance Association, “We can’t, as an industry, continue to just collect more and more money, and rebuild and rebuild and rebuild in the same way.” (Flavelle, 2021) Beyond the United States, the numbers are just as dire. Cyclone Amphan struck Bangladesh and India in May, resulting in $14 billion in damage. Asia sustained $67 billion in losses from natural disasters.

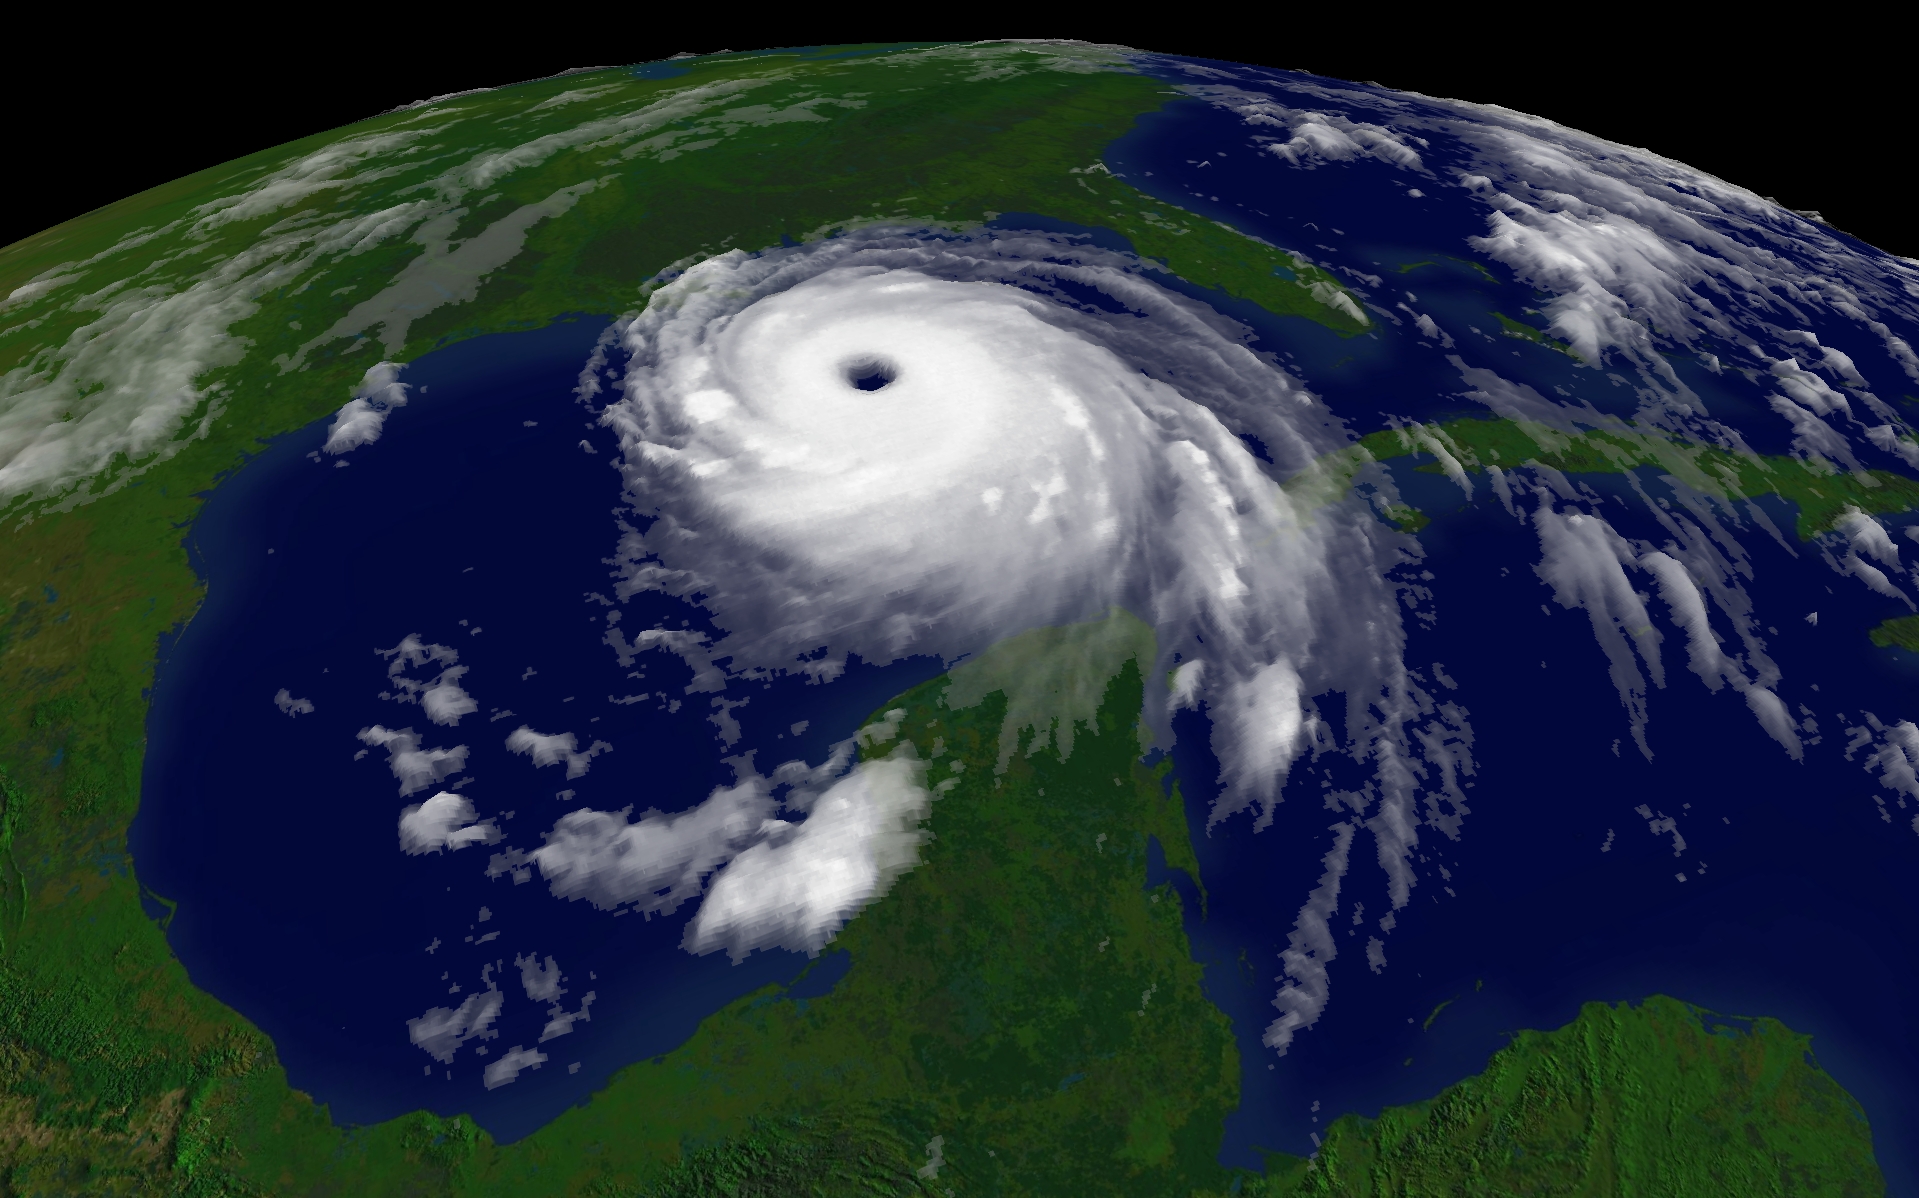
Cyclone Amphan May 2020. Image: wikimedia commons.

What does this mean for 2021? Following the money and perhaps led by the insurance industry, new ways to rebuild may lead us into the New Year. We’ll take a look at some hopeful trends, next.

American Property Casualty Insurance Association. https://www.apci.org

Flavelle, Christopher. “U.S. Disaster Costs Doubled in 2020, Reflecting Costs of Climate Change.” 7 January 2021. The New York Times. https://www.nytimes.com/2021/01/07/climate/2020-disaster-costs.html?referringSource=articleShare

Kann, Drew and Brandon Miller. “2020 was tied for the hottest year ever recorded — but the disasters field by climate change set it apart.” 8 January 2021. CNN.com. https://www.cnn.com/2021/01/08/weather/2020-global-temperatures-tied-for-warmest-on-record-copernicus/index.html

Munich Re. https://www.munichre.com/en.html

Thanks to Jason W. Lusk for editorial guidance and suggestions.

Building the World Blog by Kathleen Lusk Brooke and Zoe G. Quinn is licensed under a Creative Commons Attribution-NonCommercial-NoDerivs 3.0 Unp