WATER: Saltwater Intrusion – Rolling into the River

Saltwater is rolling in on the Mississippi River. Image: “The waves on the water” by graphic artist Elapros, 2011. Creative commons 4.0. Included with appreciation.

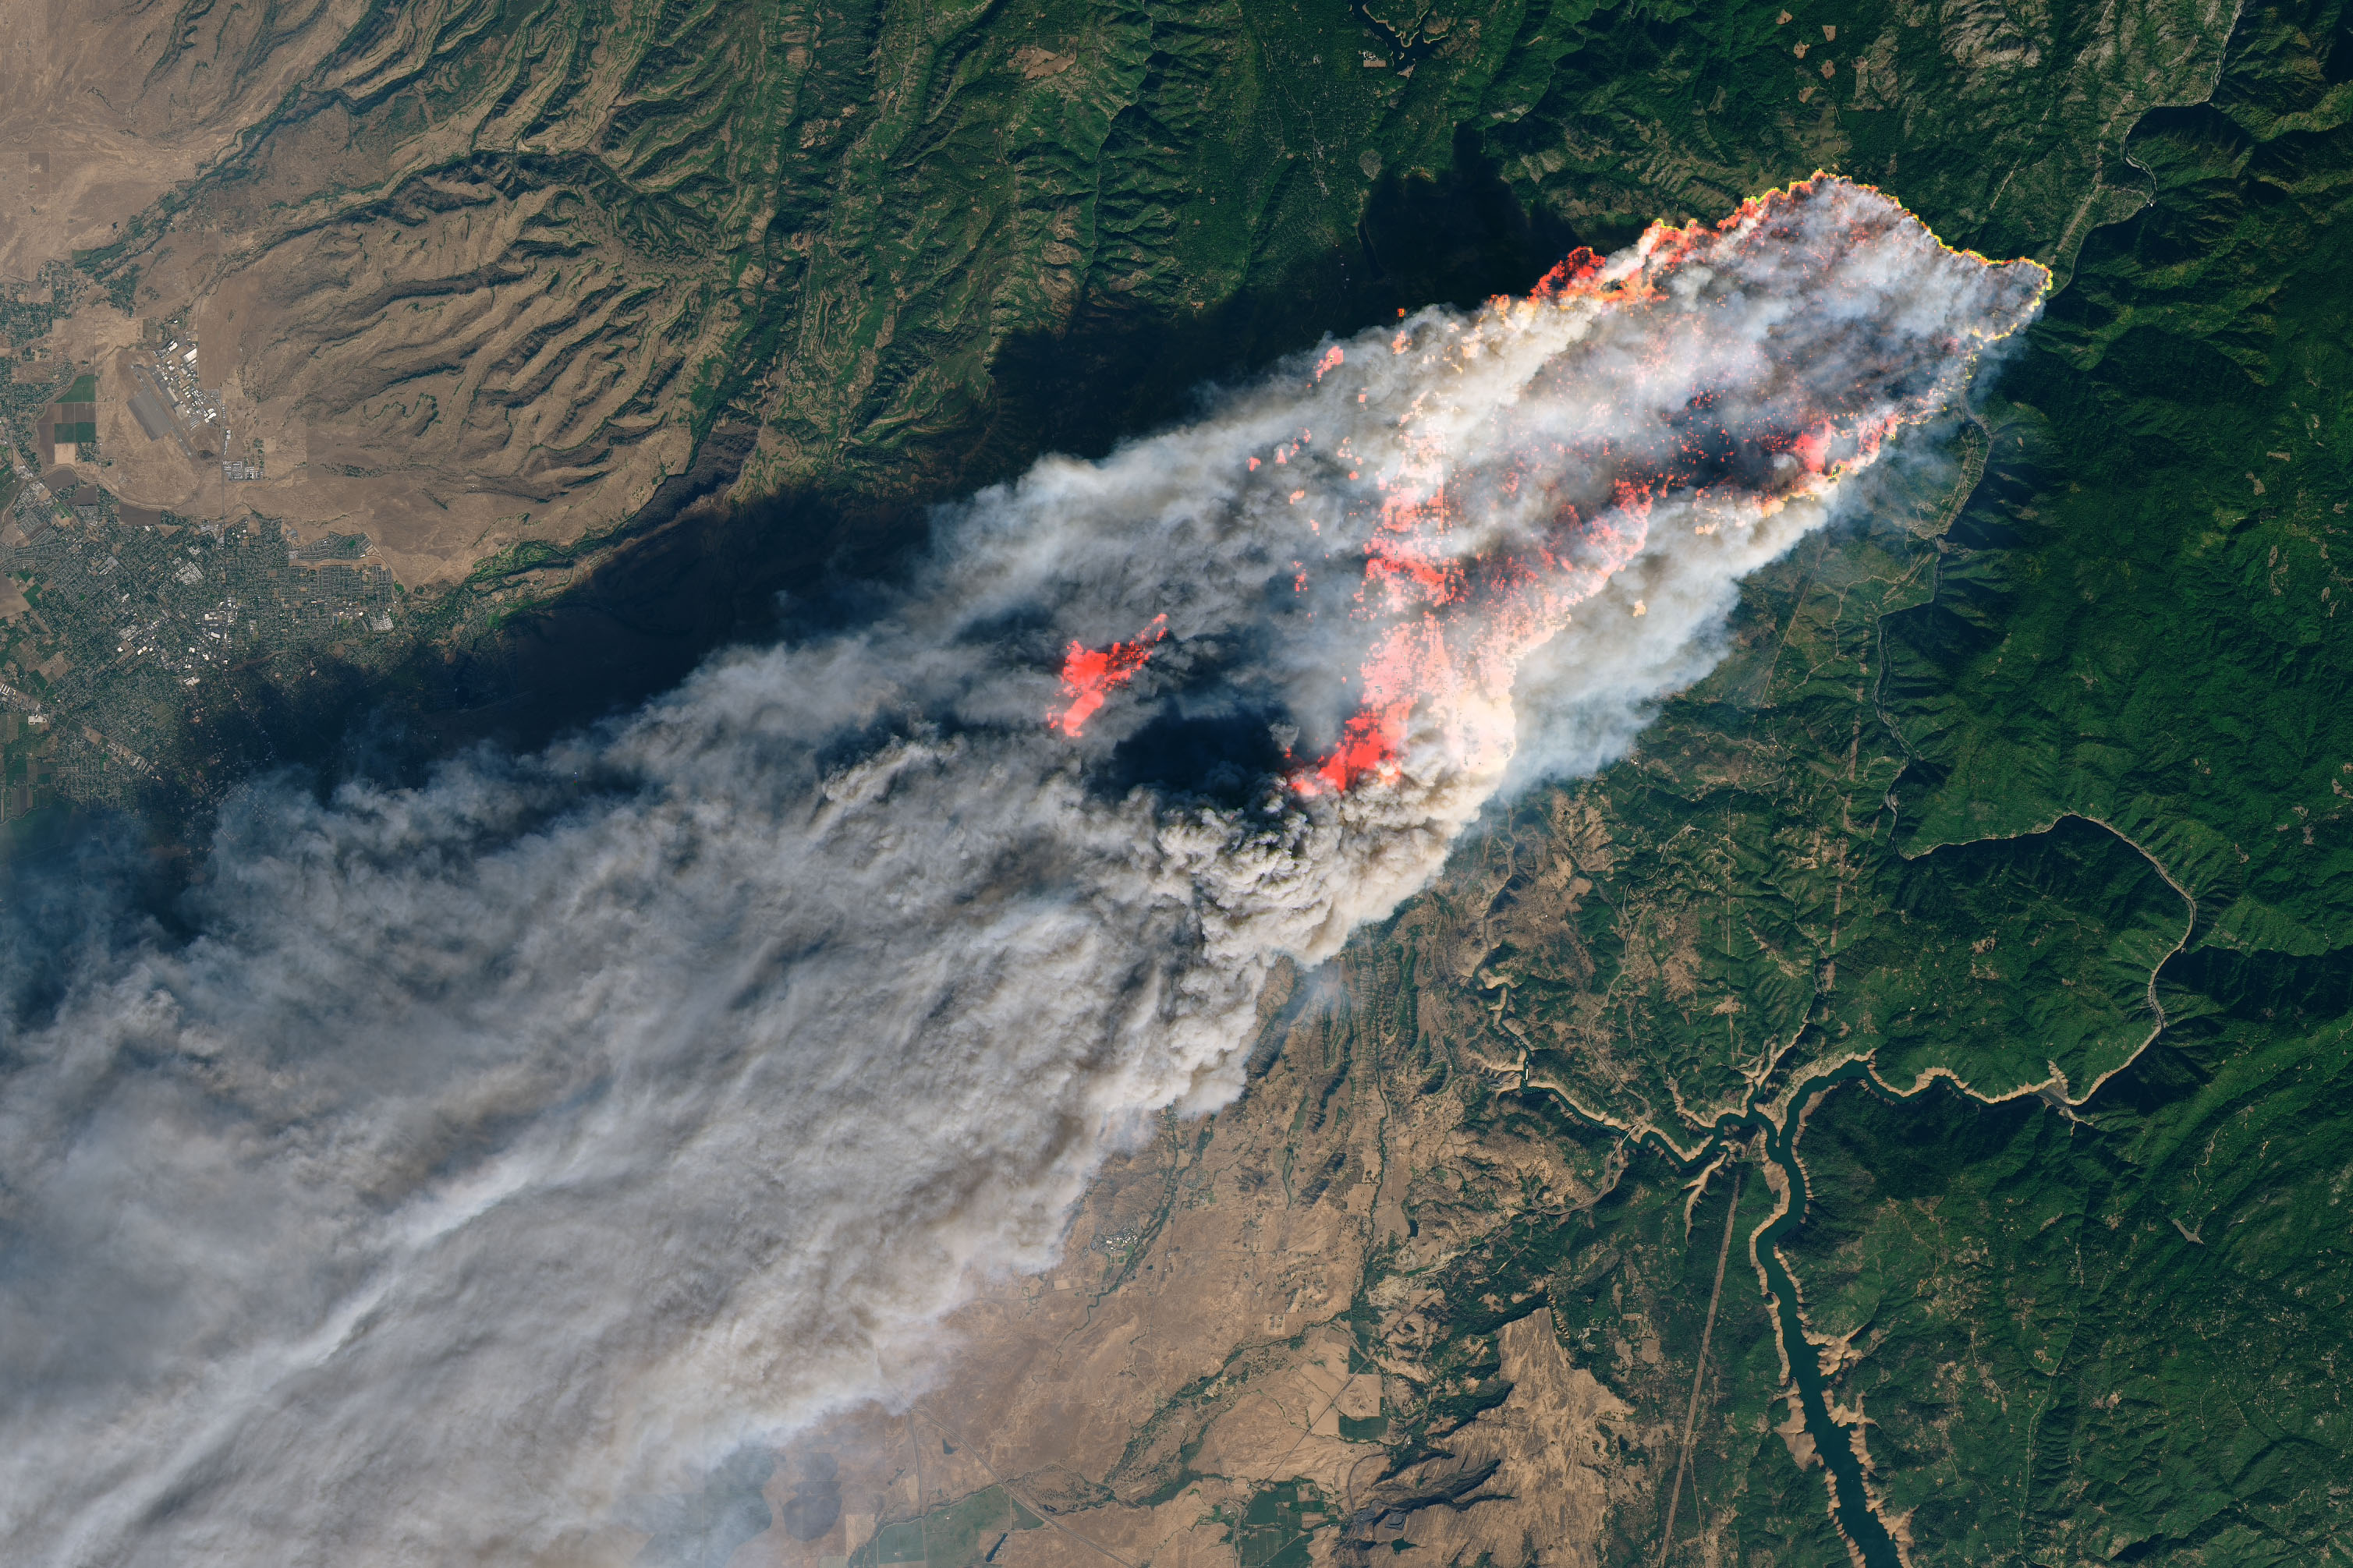
Tina Turner famously sang about Proud Mary Rollin’ on the River. But now the mighty Mississippi River is not rolling with cruise boats. A Viking line riverboat recently set sail but was stuck for an entire day on a sandbar. The Mississippi river is suffering from drought, reducing the river’s freshwater flow and allowing salty water from the Gulf of Mexico to enter the river. Affected are plants, wildlife, and people – including those in the city of New Orleans, Louisiana.

“Skyline of New Orleans, Louisiana, USA” by Michael Maples, U.S. Army Corps of Engineers, 1999. Public Domain. Included with appreciation.

With the drought depleting the Mississippi’s freshwater resources, a saltwater wedge is forming that may reach the urban area by the end of October 2023. Why a wedge? The shape is formed by differences in saltwater (more dense) and freshwater: when the two kinds of water come together, they form a wedge.


Salter intrusion can affect the environment. Another concern is the water infrastructure. Image: “Saltwater intrusion” graphic by Sweetian, 2011. Creative commons 3.0. Included with appreciation.

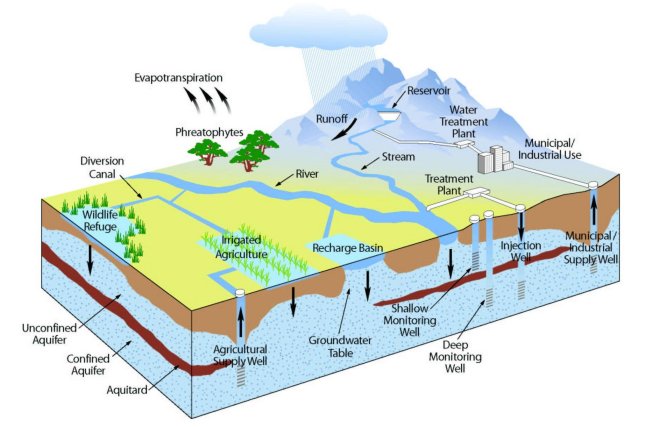
As coastal and river communities consume more water, drawing from available aquifers, seawater can encroach. That affects both farming (5% salinity makes water unsuitable for agriculture) and drinking water (2% salinity renders freshwater undrinkable). Rivers are also an important habitat for flora and fauna, estuarial environments, and wildlife: all of these are affected by salinity.

Salt can corrode. When drinking water distribution systems contain lead in the pipes, results can be disastrous. Image: “Rusted water pipe” by photographer Geographer, 2008. Creative commons 3.0. Included with appreciation.

While salty water is dangerous for a number of environmental reasons, another serious concern is its corrosive effect. Some of pipes in New Orleans’ water distribution system may still have lead. This is the case for many American cities whose pipes are older than 1986, when a law was passed that prohibits using lead in water systems. One million people in southeast Louisiana are on watch and in danger. Flint, Michigan suffered a tragedy when lead from its aging system leached into drinking water: by the time pediatrician Dr. Mona Hanna-Attisha noticed lead poisoning among patients, a generation of children were stricken. Medical treatment was $100 million; fixing and replacing the outdated pipes: $1.5 billion. Even where lead is not present, other dangerous heavy metals can be released. Anti-corrosion products are available, and the New Orleans has called a public works meeting to plan a corrosion monitoring program.

One option? Bottled water. Image: “Lots of bottled water” by photographer Nrbelex, 2006. Creative commons 2.0. Included with appreciation.

New Orleans, and the communities in southeast Louisiana, can take action now, before it is too late. But what are the options? Like the people in Flint, families can purchase bottled water. A suburb of Nola, Metaire (whose interchange of I-10/I-610 is subject to flooding) reported sales of 2,000 bottles of water daily. In New Orleans, large institutions needing water, like hospitals, were stockpiling in advance. Maybe it could be a short-term option, but it’s an environmental and health risk – over one million plastic bottles of water are sold globally – every minute! Studies reveal water from plastic bottles leaches microplastics into the human system. And then there’s the reality that very few plastic water bottles are recycled, with most ending up in landfills, river, and oceans.  Bottled water is not a long-term answer.

The U.S. Army Corps of Engineers built a sill and can improve that structure. Image: “Sill” by graphic artist Meninanatureza, 2021. Creative commons 4.0. Included with appreciation.

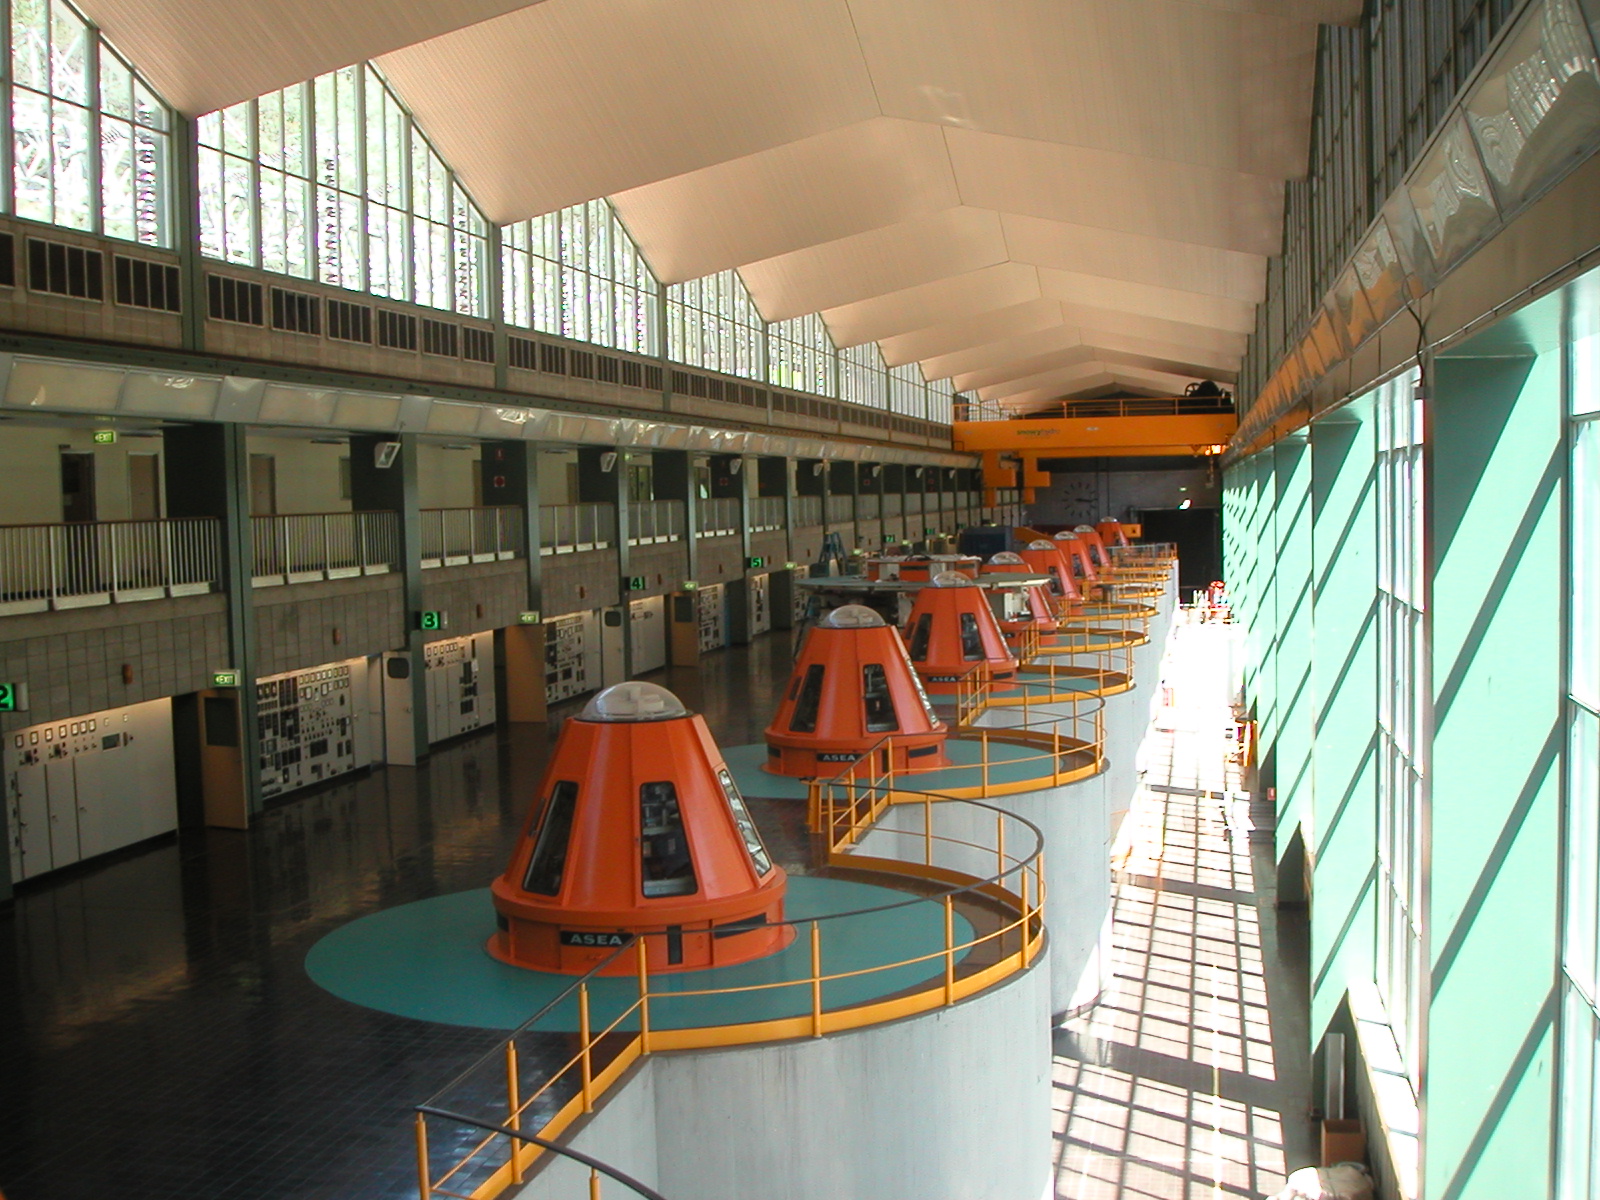
What about macro solution? In July 2023, the U.S. Army Corps of Engineers placed a “sill”  in the Mississippi River as a kind of barrier to influx of salt water from the Gulf. Now, plans are in process to raise the sill barrier by 25 feet (7.62 meters). But even at the new height, the project will only delay the inevitable by 10 or so days. Another large-scale option is building a pipe to bring fresh water from upstream. It’s like what China did with the Grand Canal – bringing water from the south to the north – but in reverse. Possible, but expensive, and not a guarantee that enough fresh water will be available in the upper river if drought conditions persist.

The MIT desalination device is the size of a suitcase. Image: “Belber Vintage Striped Suitcase,” by photographer Sandrine Z, 2014. Creative Commons 4.0. Included with appreciation.

One further option, especially if saltwater continues to flow from the Gulf of Mexico, is new desalination technology developing at MIT. The Device Research Laboratory’s Lenan Zhang and Yang Zhong, along with Evelyn Wang and team, working with Shanghai Jiao Tong University and the National Science Foundation of China, announced development of a system the size of a suitcase that can filter high-salinity water, delivering 1.32 gallons (5 liters) of drinking and cooking water per hour. It can be installed at households, and is free from electricity, running on solar power. The system is new design that solves the formerly-intractable problem of salt buildup that clogs many desalination devices. Overall, the cost of delivering drinking water is cheaper than tap water. In a feat of biomimicry, the device by thermohaline processes – (temperature “thermo” + salinity “haline”) – just like the waves of the ocean. (Chu 2023).

Mangrove leaves can excrete salt. Image: “Avicenna germinans  –  salt excretion” by photographer Ulf Mehlig. Creative commons 2.5. Included with appreciation.

Or where suitable, there is the mangrove. This coastal plant can thrive in salty environments and may even act as a filter; some mangrove leaves are able to excrete salt. Mangrove trees can help to regulate salinity: they thrive in the intertidal zones where salt and fresh water mix. Avicenna officinalis (see above) is one of the salt-secretors; this mangrove tree has evolved salt glands in the tissues that release salt.

There are more than 500 port cities endangered by saltwater intrusions; it is a challenge offering scalable innovation. Image: “Earth-Globespin” by NASA, 2015 Public Domain. Included with appreciation.

Will New Orleans serve as a case example? Other salt water wedges can be found in the estuaries of the rivers including the Columbia River of Oregon and Washington states, or the Hudson in New York. And, saltwater intrusions are not restricted to the United States. The Po River in Italy suffered damage in the Po Plain where salt water from the Adriatic entered the freshwater river: drainage from agricultural land worsened the salinization process.  In Bangladesh, southwestern coastal regions are also threatened by saltwater intrusions causing soil damage and compromising drinking water: cyclones and storm surges exacerbate the threat. Seawater intrusion is now a major problem worldwide: it even has its own acronym (SWI). Alarmingly, 32% of world coastal cities are threatened by saltwater intrusion: 500 cities are in urgent danger.

“Tina Turner,” by photographer Les Zg, 1990. Creative Commons 4.0. Included with appreciation.

As you consider the Mississippi’s present problems and possible solutions, you might like to reflect upon some of the many songs written about the legendary river. For a sample, including songs about the original and first nation people who live there, explore Mississippi River music, click here. Or, listen to Russell Batiste, Jr., to Johnny Cash’s “Big River,” and Ike and Tina Turner’s version of “Proud Mary.”

Antonellini, Marco, et al., “Salt water intrusion in the coastal aquifer of the south Po Plain, Italy. December 2009. Hydrogeology Journal 16(8): 1541-1556. https://www.researchgate.net/publication/226067653_Salt_water_intrusion_in_the_coastal_aquifer_of_the_southern_Po_Plain_Italy

Brewer, Keely “Burgeoning Mississippi riverboat industry grapples with increasing threats.” The Daily Memphian. 10 July 2023. https://www.nola.com/news/environment/flood-drought-threats-for-mississippi-riverboat-industry/article_ab3234a4-1153-11ee-95a8-f7e683994157.html

Brooke, K. Lusk. “Leaking or Lacking?” pages 5 – 14. Renewing the World: Casebook for Leadership in Water. 2023. ISBN: 9798985035933. https://renewingtheworld.com

Chu, Jennifer. “Desalination system could produce freshwater that is cheaper than tap water.” 27 September 2023. MIT News. https://news.mit.edu/2023/desalination-system-could-produce-freshwater-cheaper-0927

Coo, Tianzheng, Dongmei Han, Xianfang Song. “Past, present, and future of global seawater intrusion research: A bibliometric analysis.” 27 August 2021. Journal of Hydrology. Volume 603, Part A, December 2021, 126844. https://www.sciencedirect.com/science/articleabs/pii/S0022169421008945

Fortin, Jacey, and Colbi Edmonds. “Battling a Water Crisis: Bottles, Barges, and Maybe a Quarter Billion-Dollar Pipe.” 29 September 2023. New York Times. https://www.nytimes.com/2023/09/29/us/new-orleans-saltwater-intrusion.html

Klinkenberg, Dean. “Mississippi River Playlist.” Spotify. https://open.spotify.com/playlist/23gl91dNAgksllxBBVSd8s

LaPotin, Alina, et al., “Dual-stage atmospheric water harvesting device for scalable solar-driven water production.” 20 January 2021. Joule. Volume 5, Issue 1, pages 166-182.

New Orleans, City of. “Corrosion Control” Public Works Committee. 27 September 223. VIDEO. https://www.youtube.com/live/DS8X2ijS5LpM?ssi=0P5up0-lemTixu67.

Somssich, Marc. “How a Mangrove Tree Can Help to Improve the Salt Tolerance of Arabidopsis and Rice.” 14 December 2020. Plant Physiology 184(4): 1630-1632. PMID: 33277332. https://www.ncbi.nlm.nih.gov/pmc/articles/PMC7723112/

Tulane University, School of Public Health. “5 things to know about the saltwater intrusion of the Mississippi River.”  28 September 2023. https://sph.tulane.edu/5-things-know-about-saltwater-intrusion-mississippi-river

United States, National Park Service. “Songs of the Mississippi River.” https://www.nps.gov/miss/learn/education/songs-of-the-mississippi-river.htm

Building the World Blog by Kathleen Lusk Brooke and Zoe G. Quinn is licensed under a Creative Commons Attribution-NonCommercial-NoDerivs 3.0 U


Appreciation to Jason W. Lusk for sharing research.

Print Friendly, PDF & Email

WATER: Lahaina – Help and Hope

“Lahaina Beach – West Maui” by D. Howard Hitchcock, 1932. Hawaii State Art Museum. Creative Commons 0: public domain. Included with appreciation.

Hawai’i may often be depicted in colors of blue water and green tropical plants. But now, Lahaina, on Maui, is charred brown. Lahaina lost lives: the total of fatalities in the worst fire in US history is still rising, already surpassing deaths in California’s Camp Fire of 2018 that killed 85 people and destroyed the town of Paradise.

“Fire hydrant flushing,” by photographer Lldar Sagdejev, 2011. Creative Commons 4.0. Included with appreciation.

While heat, drought, and wind created conditions for fire, Lahaina’s municipal systems might have made it worse. Hydrants, placed along city streets for emergency water access, produced little to help firefighters. Lahaina’s water infrastructure draws water from a creek and from wells underground. But when the ravaging fire melted delivery pipes, causing them to burst, losing precious water, those leaks, in turn, affected the pressure of the whole water system, including the delivery of water to hydrants.

Fire damage and lost acreage in the U.S. has tripled in the last three decades. Image: “Wildfires burned in the United States” by Our World In Data, 2020. Creative Commons 3.0. Included with appreciation.

As the climate warms, and droughts increase, wildfires may be more frequent. In 2022, seven countries’ capitals surpassed 40-year high temperatures In South Korea, 42,000 acres burned in a fire in Uljin. In Algeria, a fire in the region of Al Taref consumed 14,000 acres. In Argentina, Corrientes province suffered a fire that charred 2, 223, 948 acres.In the USA, the named McKinney Fire burned  60,000 acres. That same year, in the European Union, over 2 million acres burned.

“Burnout on Mangum Fire” by photographer Mike McMillan/USFS, 2020. Creative Commons public domain. Included with appreciation.

Fire also damages essential infrastructure. Lahaina’s water system suffered damage; that’s not an unusual effect of fire. In Australia, when heat rose to 151 degrees Fahrenheit (66.3 Celsius) and winds gusted to 79 miles per hour (128 kilometers per hour), Snowy Mountains Hydroelectric lost some power when NSW grid links went down; 14,000 people lost electric power. Fire damaging water – the very element needed to quell flames – is not a new phenomenon.  In 1633, famous landmark London Bridge suffered a fire that damaged its waterwheels, thereby preventing pumping water to stop the flames. In Lahaina, Hawaiian Electric equipment and infrastructure of Hawaiian Electric, serving 95% of the state’s residents, suffered damage to power lines. With electric and water system affected by the fire, Lahaina’s infrastructure proved to be a factor in the scope of the disaster. An early assessment of the cost of Lahaina fire damage: $6 billion. Lahaina is both a tragedy and a warning.

How can we protect buildings and essential infrastructure? Image: “Fire in Massueville, Quebec, Canada” by photographer Sylvain Pedneault, 2006. Creative Commons 3.0. Included with appreciation.

How can we protect people and property from fires developing from heat, drought, and winds? Here are a few ways:

Assess water systems to protect hydrants and pipes

Climate-proof power grids and essential infrastructure

Limit plants (avoid non-native) and vegetation near buildings

Strengthen regulations for construction materials, emphasizing cement, stone, or stucco

Require tempered glass in windows to reduce window blow-out that fans flames

Test signal systems and err on the side of caution when issuing warnings

It is true that preventive protective measures are costly. But post-fire rebuilding costs are 10 to 50 times suppression costs. Global predictions for climate-related wildfires may reach $50 billion – $100 billion annually by 2050. While the world surely needs to quell warming; meanwhile, directing funds and attention to prevention of future fire damage is important. This will be an area of significant innovation, applicable globally.

“Maui, Hawai’i: seen by Landsat.” Image, public domain. Included with appreciation.

Lahaina’s fire was ultimately stopped by water. Flames expired when they had consumed vegetation (some non-native that burned faster) and buildings, until the blaze reached the ocean. People fleeing burning homes endangered their lives to save them by jumping into the Pacific waters. The water system of Lahaina must now be rebuilt. Can the waters of the Pacific help? Maybe. Seawater contains salt, corroding the very means of its conveyance. Moreover, salt water damages vegetation, buildings, and even fire equipment. In the future, desalination innovations may make it possible for coastal areas to use sea water for many purposes, including fire response.

“A Helping Hand” by photographer Damian Gadal, 2008. Creative commons. Included with appreciation.

HOW TO HELP:

Contact: Hawaii Community Foundation or Maui United Way, Maui Food Bank.

Visit redcross.org or text HAWAII to 90999 to make a donation.

For those who lost pets, Maui Fires Pets Help Group may provide help.

Baker, Mike, Kellen Browning, and Nicholas Bogel-Burroughs. “As Inferno Grew, Lahaina’s Water System Collapsed.” 13 August 2023. The New York Times. https://www.nytimes.com/2023/08/13/us/lahina-water-falure.html

Howard, Peter. “Flammable Planet.” September 2014. https://costofcarbon.org/files/Flammable_Planet_Wildfires_and_Social_Cost_of_carbon.pdf

Kartit, Dina et al .”Wildfires breaking out across the world.” 24 August 2022. Reuters. https://www.reuters.com/world/europe/wildfires-breaking-out-across-world-2022-07-19/

Building the World Blog by Kathleen Lusk Brooke and Zoe G. Quinn is licensed under a Creative Commons Attribution-NonCommercial-NoDerivs 3.0 U

Print Friendly, PDF & Email

CITIES: Wildfires and Climate – How to Help

Wildfires are increasing due to climate change. Image: “Burning Mangum Fire” in Arizona. Public Domain.Included with appreciation.

June 2023: Canada is on fire (below are links to help). Canadian wildfires have consumed 9.4 million acres (3.9 million hectares) – 15 times the average over the past decade. Quebec fires forced 11,000 residents from their homes; Nova Scotia suffered the largest blaze in its history. The East coast is not alone: Western British Columbia battled the second-biggest wildfire on record for the area. In Central Canada, Alberta issued evacuation orders and heat directives. Canadian railway CN is adjusting trains in several provinces. Why? Drought dries forests and heat sparks blazes. While wildfires are normal in nature, hence the term “wildfire season,” climate change is intensifying the threat to land, cities, and public health.

New York City’s Empire State Building as seen through smoke-haze from Canadian wildfires. Image “Empire State Building June 7 2023” by Aethemplaer on Twitter. Creative Commons 4.0. Included with appreciation.

No longer are fires, and related smoke, a local danger. Just south of Canada, winds blew smoke into the air of Vermont to New York to South Carolina, and then westward to Ohio and Kansas. New York City’s iconic skyline was cloaked in soot. Satellite images show the movement of smoke over Manhattan.

Smoke from Canadian wildfire blowing over New York City on June 7, 2023. Image: by NOAA. Public Domain. Included with appreciation.

The year 2023’s fire season is just beginning in North America. If recent years are a warning, it is time to take precautions. In 2022, wildfires in California, Oregon, and Washington state consumed thousands of acres, destroyed homes and agricultural land. Canadian British Columbia battled 193 wildfires in 2022, sending smoke to Vancouver and also to Seattle, Washington. Wildfires have become so frequent that they often have names: Sandia, Red, Tower, Mountain, Dixie, Camp. The latter, in 2018, burned 153,000 acres (62,000 hectares), killed 85 people, and destroyed the entire town of Paradise, California.

Camp Fire of 2018 engulfed Paradise. Image: photograph by Landsat and Joshua Stevens, NASA. Public Domain. Included with appreciation.

Wildfires are a global threat. Australia’s wildfires in 2020 spiked atmospheric temperatures and even widened the hole in the ozone layer. Fires threatened Snowy Mountains Hydroelectric‘s largest generator Tumut 3. During China’s 2020 heatwave, the city of Chongqing, home to 32 million people, relocated 1500 residents due to fires erupting. Factories suspended work for seven days. In 2022, Hunan province closed its mountain access for one month to help 4,000 firefighters battle a blaze.

Copernicus satellite system: “Europe’s eyes on Earth.” Image: Copernicus logo courtesy of European Union. Creative commons fair use. Included with appreciation.

As global space-based observation progresses, we may be able to predict wildfires. The European Forest Fire Information System (EFFIS) reports on European Union countries. EFFIS uses satellites in concert with the Copernicus Atmosphere Monitoring Service (CAMS) to observe active wildfires and estimate air quality pollution. Then, CAMS coordinates with the Global Fire Assimilation System (GFAS) to predict where the wind will blow fire pollution, sending warning to cities. Another space-based monitoring system is CAMS Biomass Burning Aerosol Optical Depth measuring how much sunlight can pass through the air (or not), indicating concentrations of particulate matter.

Image: “Grain size dependence of penetration of airborne particulate matter.” Graphic by Dr. Claire Horwell, Durham University, UK and Ken Donaldson, USGS. Creative commons public domain. Included with appreciation.

Particulate matter (PM) is the term for mixture of solid and liquid drops of pollutants suspended and carried in the air. Particles can be made of inorganic and organic compounds including soot, metal, dust, soil, pollen, mold, and little flakes of burnt matter. Small particles can be inhaled, enter the lungs and pass into the bloodstream. The tiniest particles, those less than 2.5 micrometers in diameter and known as PM2.5, are the most dangerous.

How can you tell if your local air’s PM2.5 might be at high levels? Look out any window. If air is hazy, and wind is relatively still, there is danger. Here are actions to take:

Preventing Wild Fires and Related Damage – manage forests, limit residential plantings needing extensive water, build new construction with fire-proof or fire-resistant materials, use satellite data to anticipate fire-prone areas and take preventive action.

Preventing Health Risks due to Fire and Smoke – remain indoors, do not open windows, use an air-filter device if available, cancel unnecessary outdoor exposure. If you do need to venture outdoors, wear an N95 mask (or two), and when returning, remove and launder outerwear garments that may harbor toxic residue.

Providing Help to Those Impacted by Canadian Wildfires – fires have displaced 20,000 people, destroyed property, and sent many to the hospital for smoke inhalation. Here’s some ways to help:

Canadian Red Cross – every dollar donated will be matched;

Firefighters Without Borders – support international and Canadian firefighters;

Donate a Mask – help a charity that distributes free N95 masks.

In the future, climate response will mean addressing, especially, the shared resources of the global commons. These include areas that lie beyond national jurisdiction: the high seas, outer space, and the atmosphere – the very air we breathe. Wildfires may erupt in a specific place, but winds that circle the globe bring “there” to “here.” As we respond to problems we face today, let us keep an eye on a better, cleaner, more equitable future.

But still, like air, I’ll rise. -Maya Angelou

Brooke, K. Lusk. “Designing residential and commercial communities in the age of drought and wildfires.” Renewing the World: WATER. Success Casebook. 2023. ISBN: 9798985035933.

Coleman, Jude. “Australia’s epic wildfires expanded ozone hold and cranked up global heat.” 1 September 2022. Nature. https://www.nature.com/articles/d41586-022-02782-w

European Forest Fire Information System (EFFIS) https://effis.jrc.ec.europa.eu/

Global Commons Alliance. https://globalcommonsalliance.org/global-commons/

Stack, Liam, Mike Ives, and Kevin Williams. “Here’s the latest of the widespread effects of the smoke in North America.” 8 June 2023. New York Times. https://www.nytimes.com/live/2023/06/08/us/canada-wildfires-air-quality-smoke

Williams, Nia. “Wildfires burn across Canada with little relief in sight.” 8 June 2023. Reuters. https://www.reuters.com/world/americas/wildfires-burn-across-canada-with-little-relief-sight-2023-06-08/

Building the World Blog by Kathleen Lusk Brooke and Zoe G. Quinn is licensed under a Creative Commons Attribution-NonCommercial-NoDerivs 3.0 U

Print Friendly, PDF & Email

WATER: Is the Drought OVER?

Droughts and floods will continue. Now we can predict them with GRACE. Image: “GRACE globe animation” by NASA. Public Domain, included with appreciation.

Atmospheric rivers: 11. Snow: 55 feet (16.76 meters). Rainfall: thus far in 2023, more than all of 2022. Conservation mandates and restrictions: eased. Outdoor watering: again permitted. Reservoirs: many refilled. Is California’s drought officially over? Conditions are better, but concerns remain. The issues are not restricted to California, but the state serves as a case example.

While 2023 brought relief and refilled many California reservoirs, drought is cyclical. Image: “Drought area in California” graphic by Phoenix7777, based on U.S. Drought Monitor Data. Creative Commons 4.0. Include with appreciation.

GROUNDWATER – On the surface, things certainly look better. But California’s underground aquifers are still in trouble, some at lowest levels ever recorded. After previous droughts (2007-2009, 2012-2016), California’s groundwater in the agriculturally important Central Valley recovered only 34% (2007-2009 drought) to as little as 19% (2012-2016). During drought periods, groundwater supplied 60% of California’s water, so maintaining underground aquifers is critical.

How is groundwater formed, replenished, and sustained? Image: “Groundwater.” Graphic by Dr. Andrew Fisher, California Agricultural Water Stewardship Institute, 2018. Creative Commons 4.0. Included with appreciation.

In irrigated agricultural regions with limited surface water supply, drought can have severe effects on groundwater. Recent innovations for storing floodwater underground in “water-capturing basins” hold promise. What kinds of future innovations will collect rain and flood water for future use? The Sustainable Groundwater Management Act (SGMA), passed in 2014, requires local agencies to form and fund groundwater sustainability agencies for high priority areas to control overuse of water by 2034. The United Nations raised awareness of the importance of groundwater by dedicating World Water Day 2022 to that resource with the motto: “Making the Invisible Visible.”

California obtains a portion of its water from the Colorado River. Image: “Colorado River at Horseshoe Bend” by Charles Wang, 2023. Creative Commons 4.0. Included with appreciation.

COLORADO RIVER – Surface water and underground aquifers are not the only sources. Water supplies from the Colorado River flow, at some distance, to cities and towns in Southern California. That river is still suffering through a two decade long drought that depleted reservoirs like Lake Powell and Lake Mead. Seven states, as well as many indigenous sovereign nations and also Mexico, share in the water according to rules set in the Colorado River Compact 0f 1922. If the seven states cannot come to agreement on water usage cutbacks, the federal government will step in. In April 2023, the U.S. Department of Interior’s Bureau of Reclamation introduced options. 

Floods devastated Sindh Provice, Pakistan in 2022. Image: “Pakistan floods August 27 2021 versus August 27 2022.” By NASA. https://worldview.earthdata.nasa.gov/. Image in public domain. Included with appreciation.

FUTURE  OF WATER– Satellite data confirm what we know all too well when 12 inches of rain in one day sweep through Ft. Lauderdale, Florida closing schools and highways, or floods drench Sindh Province, Pakistan,dislocating millions of people. We know and feel it when drought plagues land, dries up agricultural fields, drains reservoirs, and threatens hydroelectric facilities like those on the Po River of Italy, or  Snowy Mountains Hydroelectric of Australia or Hoover Dam of the Colorado River in the United States.

Hydroelectricity depends upon abundant water. Drought has threatened energy production on the Colorado River’s Hoover Dam. Image: “Hoover Dam” by photographer Ansel Adams, 1941. Public Domain, National Archives and Records Administration image #519837. Included with appreciation.

Hydroelectric power plants on rivers throughout the world are subject to changing water levels. If a river suffers drought, some hydroelectric facilities must be switched off. A recent study sounded the alarm. By 2050, 61% of all hydropower dams will be at high risk.

It takes two – GRACE and GRACE-FO. Image: “Gravity anomalies on Earth” by NASA, 2012. Public Domain. Included with appreciation.

Climate change will make rains more intense and droughts more frequent. The Gravity Recovery and Climate Experiment satellite duo, known as GRACE and GRACE-FO will reveal a big picture in a long view. Dr. Matthew Rodell, Deputy Director for Hydrosphere, Biosphere, and Geophysics, Earth Sciences Division, NASA, and Dr. Bailing Li, of Goddard’s Hydrological Sciences Laboratory, led a team that studied over 1,000 weather events during the period 2002-2021. Rainfall extremes were noted in sub-Saharan Africa, North America, and Australia. Intense droughts were seen in South America, the United States, and elsewhere. Droughts outnumbered rain events by 10%.  It’s costly: 20% of the USA’s annual economic loses were due to floods and droughts. Is there a solution? Using floodwater to recharge aquifers and irrigate agricultural land will be an area of innovation.

Water Futures Index – is water a trading commodity or a human right? Image: “Nasdaq” by xurde, 2007. Creative commons 2.0. Included with appreciation.

WATER FUTURES –  Another development? Water Futures trading contracts such as the Veles California Water Index (NQH20) that launched on NASDAQ in 2018. Prices have fluctuated from below $300 per AF (acre-foot which equals 325,851 gallons or 1,233,480 liters) to 18 August 2022’s price of $1,134. At today’s post date, the price is $855. Is water a commodity or a right? Some say that commodity trading makes it possible for those who use quantities of water to plan, and plant, with more certainty.

Water: human right and right of nature. Image: “Whanganui River between Pipiriki and Jerusalem” by photographer Prankster, 2012. Dedicated by the photographer to the public domain. CC 1.0. Included with appreciation.

WATER RIGHTS – But others might question water trading. On 28 July 2010, the United Nations General Assembly passed Resolution 64/292 that recognizes water and sanitation as a human right. In 2022, the Committee on Economic, Social and Cultural Rights adopted General Comment No. 15, with Article 1.1 stating “The human right to water is indispensable for leading a life in human dignity. It is a prerequisite for the realization of other human rights.” Some would say that the right to sustainable, healthy water goes beyond human rights. New Zealand’s Whanganui River recently received personhood legal status, granting the river its own rights.

We are the water planet. How do we protect and sustain water rights? Image: “Frozen water droplet” by photographer Aaron Burden, 2017. Dedicated by the photographer to the public domain. Included with appreciation.

California Department of Water Resources. “Sustainable Groundwater Management Act (SGMA). Includes VIDEO.https://water.ca.gov/programs/groundwater-management/sgma-groundwater-management

Charles, Dan. “Water is scarce in California. But farmers have found ways to store it underground.” 5 October 2021. All Things Considered, NPR. Includes AUDIO. https://www.npr.org/2021/10/05/1037370430/water-is-scarce-in-california-but-farmers-have-found-ways-to-store-it-undergroun

Insights Editorial Team. “What Investors Should Know About Trading Water in the Futures Market.” 12 January 2021. Boston University. https://insights.bu.edu/what-investors-should-know-about-trading-water-in-the-futures-market

NASDAQ. “Nasdaq Veles California Water Index Fture (H20). https://www.nasdaq.com/market-activity/futures/h20

New Zealand. “Te Awa Tupua – Whanganui River Claims Settlement Act of 2017.” https://www.legislation.govt.nz/act/public/2017/0007/latest/whole.html

O’Malley, Isabella. “Scientists confirm global floods and droughts worsened by climate change.” 13 March 2023. PBS. https://www.pbs.org/newshour/science/scientists-confirm-global-floods-and-droughts-worsened-by-climate-change

Rodell, Matthew. and Bailing. Li. “Changing intensity of hydroclimatic extreme events revealed by GRACE and GRACE-FO.” Nature Water. 1 (3): 10.1038/s44221-023-00040-5 and https://www.nature.com/articles/s44221-023-00040-5

Rohde, Melissa M. “Floods and droughts are intensifying globally.” 13 March 2023. Nature Water 1, 226-227 (2023). https://www.nature.com/articles/s44221-023-00047-y

Sommer, Lauren. “3 reasons why California’s drought isn’t really over, despite all the rain.” 23 March 2023. Morning Edition, NPR. Includes AUDIO. https://www.npr.org/2023/03/23/1165378214/3-readons-why-californias-drought-isnt-really-over-despite-all-the-rain

United Nations. “Human Right to Water and Sanitation.” https://www.un.org/waterforlifedecade/human_right_to_water.shtml

Wada, Yoshihide., et al., “Global depletion of groundwater resources.” Geophysical Research Letters 37,1.  https://agupubx.onlinelibrary.wiley.com/doi/10.1029/2010GL044571 and https://doi.org/10.1029/2010GL044571

Weir, Bill. “Thousands of acres are underwater in California, and the flood could triple in size this summer.” 15 April 2023. CNN. https://www.cnn.com/2023/04/15/us/tulare-lake-california-flood-climate/index.html

Building the World Blog by Kathleen Lusk Brooke and Zoe G. Quinn is licensed under a Creative Commons Attribution-NonCommercial-NoDerivs 3.0 U

Print Friendly, PDF & Email

WATER: Be The Change – World Water Day 2023

World Water Day 2023 – Be The Change. Image: “Water drop” by José Manual Suárez, 2008. Creative Commons 2.0. Included with appreciation.

BE THE CHANGE

Today is World Water Day 2023. This year’s theme is “Be The Change You Want To See In The World.” Here’s a list of personal commitments to solve the water and sanitation crisis. Consider actions you will take, along with your best ideas to sustain world water, and send your commitments to the Water Action Agenda at the UN 2023 Water Conference. Your voice will be heard and your ideas included in the United Nations plan for the future of world water.

Yes, I want to be the change. Image: “Yes” wikimedia, creative commons public domain. Included with appreciation.

Choose the actions you will take, then send your commitments and ideas NOW.

UN-Water. “Be The Change.” https://www.unwater.org/bethechange/

UN 2023 Water Conference. https://sdgs.un.org/conferences/water2023

Water Action Agenda. UN Sustainable Development Goals. https://sdgs.un.org/partnerships/action-networks/water

Want to find out more ways to sustain and renew world water? Please visit https://renewingtheworld.com

Building the World Blog by Kathleen Lusk Brooke and Zoe G. Quinn is licensed under a Creative Commons Attribution-NonCommercial-NoDerivs 3.0 Un

Print Friendly, PDF & Email

WATER/ENERGY: Hydroelectricity – What is the Future?

Lake Mead is shrinking through prolonged drought. That will affect hydroelectricity generated by the Hoover Dam. Image: “A Comparison of Lake Mead 2000 and 2015,” by Joshua Stevens, NASA Earth Observatory, using Landsat data from U.S. Geological Survey. Image from the Public Domain: wikimedia and nasa.gov. Included with appreciation.

Drought affecting the Colorado River, and resultant depletion of reservoirs Lake Mead and Lake Powell, may soon bring about Tier 2 shortage conditions. When Lake Mead’s water level falls below 1,050 feet above sea level, the new normal will reduce water allotments for Arizona, Nevada, and Mexico. Arizona will face a 21% reduction. Lake Mead’s drought is so big that is it now visible from space. Water for drinking, agricultural irrigation, and industry will be affected.

Will water continue to course through the Hoover Dam’s jet-flow gates? “View of Hoover Dam with jet-flow gates open,” by U.S. Bureau of Reclamation, 1998. Public Domain image. Creative Commons, wikimedia. Included with appreciation.

But there may be more consequences. The Colorado River, down 40% from 2021, flows through the Hoover Dam, generating electricity. If Lake Mead’s water recedes below 1,000 feet (just 50 feet above Tier 2 danger level), “dead pool” will happen, meaning water cannot flow downstream to power the dam. The Hoover Dam supplies electricity to Arizona, California, and Nevada. Western parts of the United States have suffered a prolonged drought; hydropower has dropped to 14% below its 10-year average.

Hydroelectric power is also threatened in other locations around the world. Italy recently suffered electricity reductions due to drought on the Po River. India and Pakistan share water usage, including hydroelectric access, under the terms of the Indus Waters Treaty; eight new hydropower plants have just been approved.

“Murray-1 Hydroelectric Power Station, Snowy Mountains,” by photographer Ear1grey, Dr. Rich Boakes. CC3.0, wikimedia, included with appreciation.

The Murray River of Australia, key to Snowy Mountains Hydroelectric, is now seriously affected by drought; water for drinking, agriculture, and electricity may be threatened. Brazil’s water flows into hydro dams reached a 90 year low, affecting facilities including Itaipú. The alternatives, when hydro fails to produce, may include greater reliance on fossil fuels. Many are concerned about that direction.

The Indus River may add eight new hydropower plants. Image: “Indus River near Skardu, Pakistan,” by Kogo, 2004. GFDL Public Domain, wikimedia. Included with appreciation.

In a world of climate change, increasing droughts may lead to a rethinking of hydroelectric power which, in 2020, generated 1/6th of the world’s electricity. Hydroelectric facilities can be found in 150 countries, with China the largest producer. Global investment in hydroelectricity is significant, and growing; will it be a wise investment?

Hydroelectric Power has a low carbon footprint, and is valuable in a time of climate change. Illustration: “Carbon Emissions by Electricity Source,” by Vattenfall and Japan’s Central Research Institution for the Electric Power Industry, 1999. Image in the public domain, wikimedia. Included with appreciation.

Hydropower is low-carbon electricity, a property valuable in a world trying to limit carbon emissions. Hydropower is also continuous, an important factor to balance intermittency of renewables like solar or wind. The future of hydroelectric power is linked to the future of water. How will recent funding of climate preservation and protection support water sustainability? Will water innovations help harness the power of water to power the future?

Brooke, K. Lusk. “Colorado River.” Renewing the World: WATER. pages 86-95.  Cambridge: 2022. ISBN: 9798985035919.

CNN. “New water cuts coming for Southwest as Colorado River falls into Tier 2 shortage.” 16 August 2022. https://www.cnn.com/2022/08/16/us/colorado-river-water-cuts-lake-mead-negotiations-climate/index.html

Energy Information Administration. “Drought effects on hydroelectricity generation.” 30 March 2022. https://www.eia.gov/today/inenergy/detail.php?id=51839

“Hydro Electric Projects in Indus Basin.” http://indiawris.gov.in/wiki/doku.php?id=hydro_electric_projects_in_indus_basin

Itaipú Binacional. “ITAIPÚ will host global Water and Energy Conference.” 24 January 2022. https://www.itaipu.gov.br/en/press-office/news/itaipu-will-host-global-water-and-energy-conference

National Integrated Drought Information System (NIDIS) and American Planning Association. “Falling Dominoes: A Planner’s Guide to Drought and Cascading Impacts.” 31 October 2019. https://www.drought.gov.

Robbins, Jill. “Dry Rivers Threaten Production of Clean Energy.” 23 August 2021. Voice of America: Science & Technology.

United Nations/India and Pakistan. “Indus Waters Treaty.” 1960. https://treaties.un.org/doc/Publication/UNTs/Volume%20419/volume-419-I-6032-English.pdf

Building the World Blog by Kathleen Lusk Brooke and Zoe G. Quinn is licensed under a Creative Commons Attribution-NonCommercial-NoDerivs 3.0 Un

Print Friendly, PDF & Email

WATER and ENERGY: Beyond a Drought

June 2022: an early heat wave intensifies drought. Image: “Heat Wave in United States June 13-19, 2021,” by NOAA. Public Domain, creative commons. Included with appreciation to NOAA.

Is it climate change, or just a heat wave? Maybe the former is intensifying the latter. This week, 60 million people in the United States are enduring extreme heat. Texas broke a heat record on June 12 as the electrical grid strained with the number of people turning on air conditioners. Families noted unusual new residents as outdoor insects crawled into any available shelter to escape sweltering heat. Wildfires sparked: more than 30 recent conflagrations burned one million American acres.

Drought may impact hydroelectricity. Image: “Hoover Dam and Lake Mead, – 2007” by photographer Waycool27, and dedicated to the public domain by the photographer. Included with appreciation.

Heat waves add to concern about drought, an ongoing challenge. Lake Mead, the nation’s largest water reservoir, recently marked its lowest level on record since 1930. The Colorado River, source of Lake Mead’s water, recently reported historic new water shortages, triggering enforced reductions along the Upper and Lower Basin states. Now 143 feet below the target full level, Lake Mead’s drop is as deep as the Statue of Liberty is high. That water drop threatens the water supply of millions of residents, farmers, industrial operations, and others. At 36% capacity, if the water in Lake Mead continues to fall (it has been losing more than 1,000 Olympic-sized swimming pools – every day – for the last 22 years), the hydropower capability of the Hoover Dam (which formed Lake Mead) will also be threatened. Engineers and scientists are watching: if Lake Mead drops another 175 feet, the Hoover Dam will reach “dead pool” (895 feet) and the great dam will fall silent. Because 90% of Las Vegas water comes from Lake Mead, that city will not only have less electricity but very little water. (Ramirez et al., 2021)

“Tennessee Valley Authority” Image 2977 by TVA, 2018. This image is the public domain and included with appreciation.

It’s not just Lake Mead and the Hoover Dam that are of concern due to heat and drought. The Tennessee Valley Authority, one of the nation’s first hydroelectric major achievements, warned customers both residential and commercial to turn off the lights. Nashville Electric Service asked people to turn down air conditioning. Itaipú, harnessing the Paraná River, has similarly found drought threatening its hydroelectric capability.

“Talbingo Dam of Snowy Mountains Hydroelectric.” There are 16 dams in the system. Photograph by AYArktos, dedicated to the public domain, creative commons. Included with appreciation.

Hydroelectricity, as the term indicates, is dependent upon water. Australia recently announced Snowy Hydro 2.0, in an effort to double electrical output of Snowy Mountains Hydroelectric. But the snowy part is problematic now that climate change is threatening snowmelt. Further concern is that 35% percent of the “Australian Alps” have seen wetland loss. Now, snow cover may reduce by 20% to as much as 60%.

What happens if water becomes non-renewable? Image: “Dry riverbed in California,” by NOAA, 2009. Included with appreciation.

Drought has serious consequences for agriculture, habitation, and now hydroelectricity. Hydroelectric power is one of the earliest and most widely applied methods of generating electricity from renewable sources. What happens if or when water becomes non-renewable?

Daley, Beth et al., “Snowy hydro scheme will be left high and dry unless we look after the mountains.” 22 March 2017. The Conversation. https://theconversation.com/snowy-hydro-scheme-will-be-left-high-and-dry-unless-we-look-after-the-mountains-74830

David, Molly. “Nashville Electric Service asks customers to help lessen energy use during high temperatures.” The Tennessean. 13 June 2022. https://www.tennessean.com/story/news/local/2022/06/13/heat-wave-tennessee-2022-nashville-electric-service-customers-conserve-power/7613867001/

Ramirez, Rachel, Pedram Javaheri, Drew Kann. “The shocking numbers behind the Lake Mead drought crisis.” 17 June 2021. CNN. https://www.cnn.com/specials/world/cnn-climate

Spang, Edward, William Moomaw, Kelly Gallagher, Paul Kirshen, David H. Marks. “The water consumption of energy production: An international comparison.” 2014. Environmental Research Letters. 9. 105002. 10.1088/1748-9326/9/10/105002 and https://www.researchgate.net/publication/266620784_The_water_consumption_of_energy_production_An_international_comparison

Building the World Blog by Kathleen Lusk Brooke and Zoe G. Quinn is licensed under a Creative Commons Attribution-NonCommercial-NoDerivs 3.0 Un

Print Friendly, PDF & Email

ENERGY: Taxing the air (from cows and sheep)

Can taxing cows help fulfill the Global Methane Pledge? Image: “Two Cows” by photographer Kaptain, 2005. Creative Commons wikimedia CC1.0. Dedicated to the public domain by the photographer; included with appreciation.

Carbon taxing is widely discussed, but New Zealand may be the first to tax a source of methane emissions usually excluded from discussions around bank and government conference rooms. The new source of carbon taxes? Cows and sheep.

Glasgow, Scotland, site of COP26 and the Global Methane Pledge. Image: “University of Glasgow,” U.S. Library of Congress, circa 1890-1900. Wikimedia Public Domain. Included with appreciation.

Since the Global Methane Pledge of COP 26 in Glasgow, Scotland, countries have promised to reduce methane by 30% by  2030, with 100 nations participating.  Methane is the second-most prolific greenhouse gas, and while it has a shorter life than carbon dioxide, methane is far more potent and dangerous. Over a 20 year period, methane is over 80 times more potent than carbon dioxide. So, stopping methane emissions is both a short-term step and a big win.

Fracking causes methane emissions. Image: U.S. Energy Information Administration, 2013. Wikimedia Pubic Domain, included with appreciation.

Over 40% of methane (CH4) comes from natural sources like land, especially wetlands, but the rest is human-driven. Natural gas, especially that obtained by hydraulic fracturing or fracking, accounts for a major part of methane emissions: the United States leads in this sad statistic. Fracked shale wells may leak over 7% of the methane in the atmosphere.

New Zealand has 26,000,000 sheep, a major source of methane. Image: “Baby Lamb,” by photographer Petr Kratochvil, 2014. Dedicated to the public domain by the photographer and included with appreciation.

But methane is also emitted when sheep and cows burp. And New Zealand has plenty of both. While there are only five million people in New Zealand, there are 26 million sheep and 10 million cows. Half of New Zealand’s methane emissions come from animal sources. Under the taxation proposal, starting in 2025, farmers will pay a carbon tax on their animal belches. Monies derived will be directed to agricultural research and approaches to dietary change. Reducing beef and lamb consumption will help lessen methane emissions, and conserve land now used for grazing. For cattle and sheep that remain, nutritional approaches like including lemongrass or seaweed in animal feed may also mitigate methane release. Australia is feeding cows a form of pink seaweed “Asparagopsis” that reduces the carbon in burps (and flatulence) by 99%. That’s significant because one dairy cow can emit enough methane to fill 500 liter bottles – per day.

“Sheep on the Move in New Zealand,” by photographer Bernard Spragg. Dedicated to the public domain. Creative Commons 1.0. Included with appreciation.

New Zealand would be the first country to place a price, and a tax, on agricultural emissions. Will this financial innovation help to balance the food-water-energy nexus?

CCBC. “Climate change: how cow burps and pink seaweed can affect the planet.” 17 August 2019. https://www.bbc.co.uk/newsround/49368462

Friedlander, Blaine. “Study: Fracking prompts global spike in atmospheric methane.” 14 August 2019. Cornell Chronicle. Cornell University. https:/news.cornell.edu/stories/2019/08/study-fracking-prompts-global-spike-atmosphereic-methane

Global Methane Pledge. https://www.globalmethanepledge.org/

Hoskins, Peter. “Climate change: New Zealand’s plan to tax cow and sheep burps.” 9 June 2022. BBC News. https://www.bbc.co.uk/news/business-61741352

Plewis, Ian. “Taking action on hot air: Why agriculture is the key to reducing UK methane emissions.” 24 May 2022. University of Manchester, UK. https://blog.policy.manchester.ac.uk/sci-tech/2022/05/taking-action-on-hot-air-why-agriculture-is-the-key-to-reducing-uk-methane-emissions/

Spang, Edware et al., “Food-Energy-Water-(FEW) Nexus: Informal Water Systems.” https://spang.ucdavis.edu/food-energy-water-few-nexus

Building the World Blog by Kathleen Lusk Brooke and Zoe G. Quinn is licensed under a Creative Commons Attribution-NonCommercial-NoDerivs 3.0 Un

Print Friendly, PDF & Email

ENERGY: Aloha


“Waikiki Beach, Diamond Head, Oahu,” by D. Howard Hitchcock, Hawaii 1928. Image: wikimedia in the public domain. Included with appreciation to D. Howard Hitchcock.

Aloha means both hello and goodbye. It’s a fitting word for transitions. Here are two case examples of solar policy changes in Hawaii and in Australia.

Hawaii is a perfect location for renewable energy: sunshine and wind are abundant. Yet, even with its natural advantages of sun and wind, Hawaii has been slow to move away from fossil fuels. But when electricity rates increased by 34% (from April 2021 to April 2022), homeowners who pay those hiked rates began to install solar. Now, more than one-third of all residential buildings in Hawaii have solar roofs. Could Hawaii serve as a case example of the challenges, and paths, to transitioning from fossil to renewable energy?

“Hawaii solar: a photovoltaic power station.” by photographer Reegan Moen, U.S. Department of Energy, 2017. Wikimedia public domain. Included with appreciation to Reegan Moen and U.S. Department of Energy.

Policy matters. Just a few years ago, Hawaiian Electric, the largest power provider in the island state, lobbied to reduce rebates for rooftop solar. In 2015, utilities slashed revenues for excess energy sent to the grid by homeowners. But Hawaii has changed policies now, offering incentives up to $4,000 for Oahu residents to install home batteries for solar systems: the utilities now siphon excess power between 6pm – 8:30 pm, when demand peaks. Policy has encouraged solar adoption: legislating a Performance Based Regulation (PBR) for Hawaiian Electric now makes renewable sources easier to adopt and link, further aiding homeowners in their rooftop systems. Kauai has made the most progress: 70% of the island’s electricity is carbon-free and expected to increase to 90% with more solar and a hydroelectric plant that both creates and stores energy.

How will geopolitics hasten the clean energy transition? “Top Oil Producing Countries,” by U.S. Department of Energy, 2022. Image: wikimedia, public domain. Included with appreciation.

Geopolitics recently hastened the transition. In 2021, oil-supplied power plants delivered two-thirds of Hawaii’s electricity. Most of that oil (80%) was imported from Russia (as well as Argentina and Libya), while 20% was obtained from Alaska. Further, Hawaii is about to close its major coal plant. Forces of war and threats to supply have turned Hawaii in the direction of the sun. There is still debate over what kind of solar is best: utilities prefer large-scale options; but macro-scale means large tracts of land, something Hawaii does not have in abundance. Hawaii has set a new goal to achieve 100% renewable energy sources: it is the first American state to do so. Recently, other states have set the same goal. Cities are making solar decisions ahead of states. Hawaii’s Honolulu has three solar panels per person; California’s Los Angeles ranked number one of 57 cities surveyed for total installed solar capacity in 2019, while Nevada’s Las Vegas is close behind. In 2019, more solar capacity was added to the U.S. grid than any other energy source.

“The Famous Bondi Beach, Australia,” by photographer Alex Proimos, 2012. Image: creative commons 2.0. Included with appreciation to Alex Proimos.

Another place in the sun? Bondi Beach, Australia, home of  Snowy Mountains Hydroelectric.  Australia drew 76% of its total energy from fossil fuels in 2020 with a mix of coal (54%), gas (20%), and oil (2%). Australia plans to close its largest coal plant in 2025 (seven years earlier than scheduled) and is now picking up the pace in solar. Australia increased rooftop solar installations by 28% from 2019 to 2020 – one in four homes there have solar panels: incentives and grants, contributed to the change. By 2020, renewable energy reached 24% of Australia’s power array. How much did the Renewable Energy (Electricity) Act of 2000 accelerate the change? Will the 2022 election of a new Australian government advance climate action?

“Sunlight on the face of Earth,” by NASA Earth Polychromatic Imaging Camera (EPIC) that tracks sunlight , from Deep Space Climate Observatory (DSCOVR)” by NASA 2017. Image: wikimedia public domain. With appreciation to NASA.

Hawaii and Australia may serve as examples of how natural resources like sun and wind interact with policy and geopolitics in a dynamic system influencing factors driving the transition from fossil fuels to renewable energy. What kinds of laws and policies are needed to encourage change?

Australia, Federal Register of Legislation. “Renewable Energy (Electricity) Act 2000.” C2019C00061. https://www.legislation.gov.au/Details/C2019C00061/Html/Text

Australian Government of Industry, Science, Energy, and Resources. “Australian electricity generation – fuel mix.” 2020. https://www.legislation.gov.au/Details/C2019C00061/Html/Text

Environment America Research and Policy Center, and Frontier Group. “Shining Cities 2020: The Top U.S. Cities for Solar Energy.” 2020. https://environmentamerica.org/feature/ame/shining-cities-2020

Harlow, Casey. “Honolulu tops national list for solar energy generation.” 19 April 2022. Hawaii Public Radio. https://www.hawaiippublicradio.org/local-news/2022-04-19/honolulu-tops-national-list-for-solar-energy-generation

Hawaii Public Utilities Commission (PUC). “Performance Based Regulation (PBR).” Decision and Order No 37787, 17 May 2021. https://puc.hawaii.gov/energy/pbr/

Paul, Sonali. “Australia’s biggest coal-fired power plant to shut in 2025.” 16 February 2022. Reuters. https://www.reuters.com/business/energy/origin-shut-australias-biggest-coal-fired-power-plant-225-2022-02-16/

Penn, Ivan. “Hit Hard by High Energy Costs, Hawaii Looks to the Sun.” 30 May 2022. The New York Times.

Building the World Blog by Kathleen Lusk Brooke and Zoe G. Quinn is licensed under a Creative Commons Attribution-NonCommercial-NoDerivs 3.0 Un

Print Friendly, PDF & Email

WATER: Mapping YOUR Climate Risk

What is your climate risk? Animation created by SaVi software from Geometry Center, University of Minnesota by Grand DixenceWikipedia for view of Iridium coverage. Image animation edicated to the public domain (CC1.0) by its creator, and included here with appreciation.

Climate change brings risk. For some, it is water: floods, storms, and sea-rise. For others, it is drought: water shortages, crop losses, and wildfires. Floods killed 920 people in Belgium and Germany, 192 in India, 113 in Afghanistan, and 99 in China – in one month (July) of 2021. Deaths from floods and related landslides took the lives of people in Bangladesh, Japan, Nepal, Pakistan, and Yemen that same year. (Davies 2021)

“Flooding in Cedar Rapids, Iowa, USA.” Photographed by Don Becker, USGS, 2008. Dedicated to the public domain (CC1.0) by United States Geological Survey and included here with appreciation.

Previous data from weather sources tracked flood risk, resulting in flood insurance for many properties (and denial of such insurance for locations too vulnerable to merit rebuilding). Water damage will only increase with climate warming, as storms grow more powerful. Rising sea levels will escalate floods and coastal inundations. Those who live in the territories of the Colorado River know well another risk related to water: drought. Water scarcity has ravaged crops, parched residential landscapes, reduced drinking water supplies, and now threatens hydropower created by the Hoover Dam. Australia, the most arid continent on Earth, is vulnerable crop loss, and electricity reduction in facilities like Snowy Mountains Hydroelectric Power.

California Fires in 2021. “Erber Fire in Thousand Oaks,” by Venture County Fire Department Public Information Office. Dedicated to the public domain (CC1.0) and included here with appreciation.

Drought also brings another danger: wild fire. Fire risk is growing with climate warming. In 1980, fire damage in the United States tallied $10 billion; in 2021, costs reached $300 billion. Worldwide, fire affects 1.5 million square miles (four million square kilometers) of Earth – each year. To picture that, the area would measure one-half of the continental United States, or more than the entirety of India. Using data from satellites like the Copernicus Sentinel-3, and the European Space Agency (ESA). the Centre for Research on the Epidemiology of Disasters tracked 470 wildfire disasters (incidents affecting more than 100 people) since 1911, totaling $120 billion in damages. The 2021 Dixie Fire in California devoured 626,751 acres (253,647 hectares); that same year, in Siberia, wildfires destroyed 3.7 million acres (1.5 million hectares) to become the largest wildfire in documented history. In 2022, the Calf Canyon-Hermits Peak fire in New Mexico continues burning over 270,00 acres and is still (at this writing) only 29% contained. The cumulonimbus flammagenitus cloud ( or CbFg or pyroCb) from the fire could be seen from space on NASA’s Aqua satellite via MODIS.

What’s your property’s climate risk? Photography by Antan0, 2010. Image of magnifying glass. CC4.0; included here with appreciation.

Would you like to know what the future looks like in your area? Now, a new mapping technology from the First Street Foundation can help you determine your risk. If you live in the United States, enter your street address, or your zip code, and you will see if you are one of 30 million properties vulnerable to flooding or wildfire. To assess your own property’s risk, click here.

Aqua Mission. Earth Observing System, NASA. https://aqua.nasa.gov/content/aqua-earth-observing-satellite-mission

Centre for Research on the Epidemiology of Disasters. https://www.cred.be

Copernicus Sentinel-3. “Measuring Earth’s oceans, land, ice, and atmosphere to monitor and understand global dynamics.” European Space Agency (ESA). https://www.esa.int/Applications/Observing_the_Earth/Copernicus/Sentinel-3

Davies, Richard. “Worldwide – Over 920 People Killed in Floods and Landslides in July 2021.” 2 August 2021. Floodlist. https://floodlist.com/asia/world-floods-july-2021

First Street Foundation. “Make climate risk accessible, easy to understand, and actionable for individuals, governments, and industry.” https://firststreet.org/mission/

Haddad, Mohammed and Mohammed Hussein. “Mapping Wildfires around the World.” 19 August 2021. Al Jazeera. https://www.aljazeera.com/news/2021/8/19/mapping-wildfires-around-the-world-interactive

Risk Factor. “A property’s flood or fire factor.” https://riskfactor.com

Building the World Blog by Kathleen Lusk Brooke and Zoe G. Quinn is licensed under a Creative Commons Attribution-NonCommercial-NoDerivs 3.0 Un


Print Friendly, PDF & Email