TRANSPORT: Interoceanic Connections

Geography is destiny, some observe. Timing accelerates the pace. And now, climate might be changing both. It is Mexico’s time?

Mexico’s Isthmus of Tehuantepec connecting Pacific to Atlantic might complement the Panama Canal, and offer a number of opportunities for transport. Image: “Isthmus of Tehuantepec” by Kbh3rd, 2007. Creative Commons 3.0. Included with appreciation.

Mexico’s Isthmus of Tehuantepec, spanning the Pacific Ocean from Oaxaca to the Atlantic Gulf at Veracruz, has always fascinated visionaries who could see a highway, a railway, or a canal opening a transoceanic route of 188 miles (303 kilometers). Archival records show 16th century sketches of a connection. In 1811, a canal was proposed by Alexander von Humboldt who had traveled to the isthmus from 1799-1804: he also proposed another connective site that is now the Panama Canal. The route chosen by von Humboldt made clear the advantage of geography that can offer connection.

Map of Alexander von Humboldt’s expedition: 1799-1804. Image by Alexrk2, 2009. Creative Commons 2.5. Included with appreciation.

Macro engineering needs the right time and the right leader. The Channel Tunnel, linking England and France, had been envisioned by Napoleon, resisted by General Wolseley, but finally achieved in a design initiated by Frank P. Davidson along with a team of diplomats, engineers, and financiers: it is now the site of Eurotunnel.

Not everyone seeks closer connection. General Wolseley, seen here riding the fleeing lion, opposed the Channel Tunnel. Image: F. Graetz, 1885, from Puck Magazine. Public Domain.

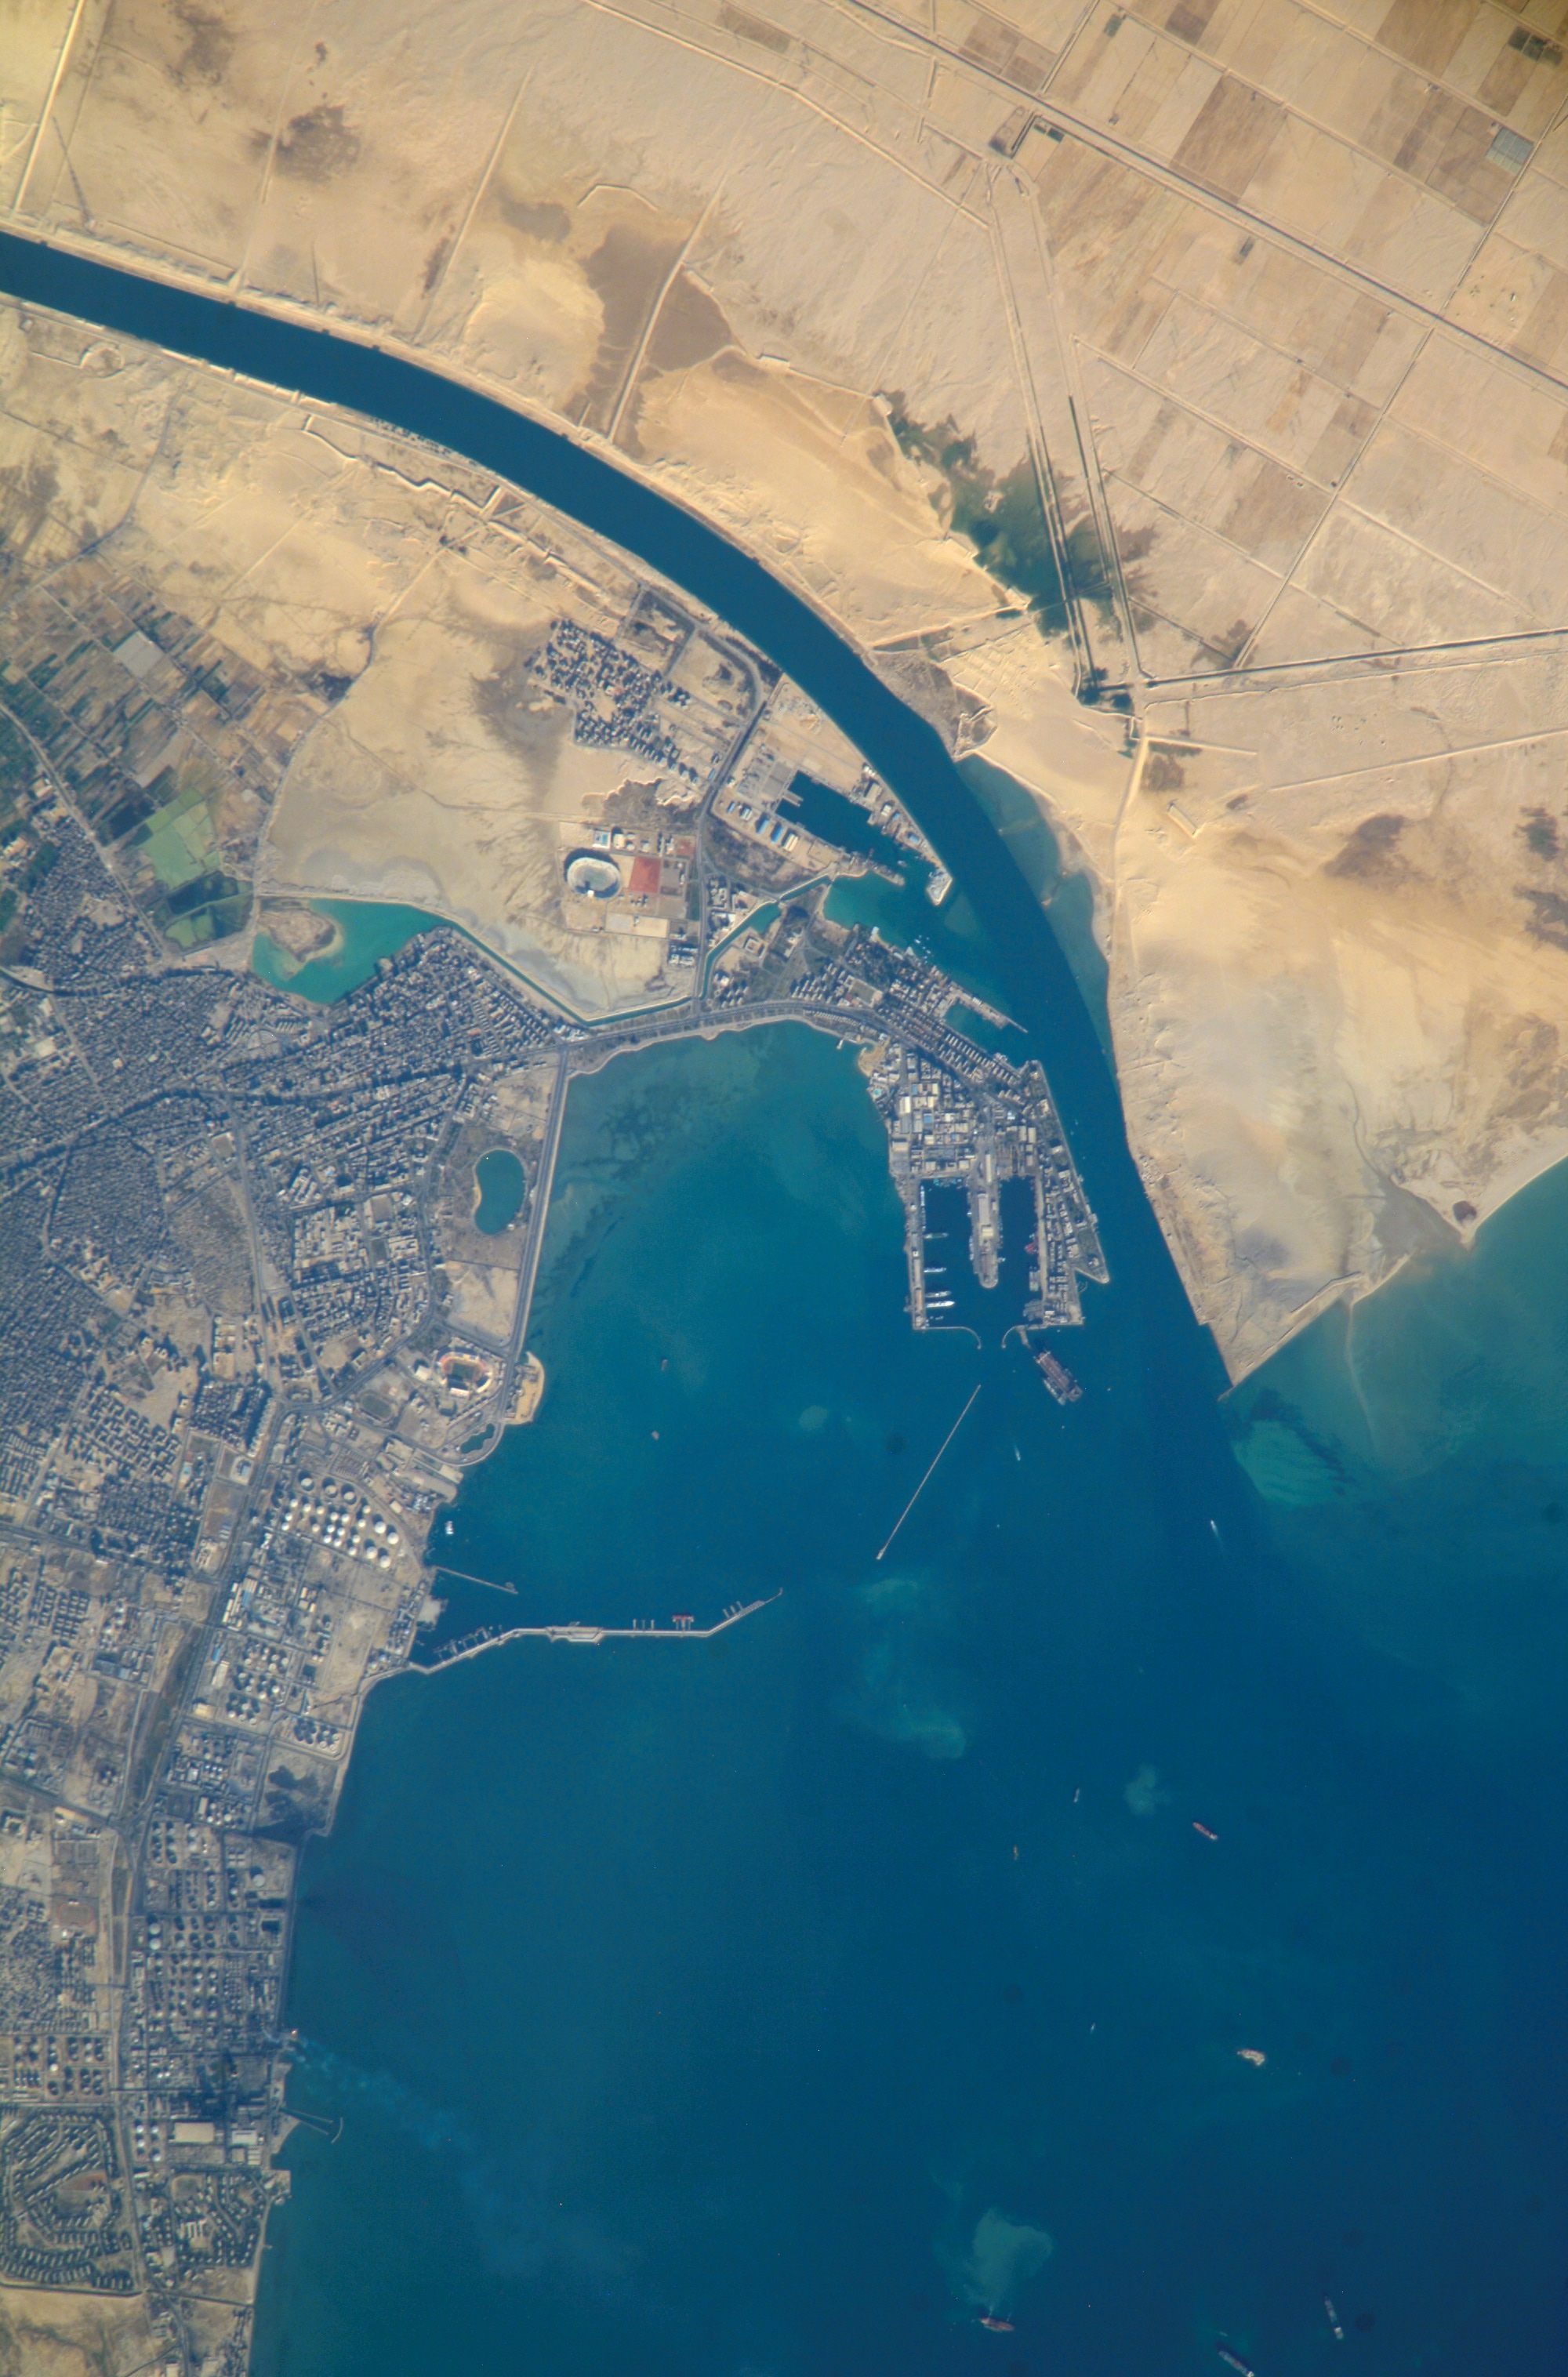
Many tried to optimize the connective advantage of Mexico’s Isthmus of Tehuantepec. Mexico’s President Anastasio Bustamante proposed an 1837 plan for a railway. In 1842, the government (provisional) of Antonio López de Santa Anna granted José de Garay a fifty-year toll collection privilege in return for a survey leading to construction. (A similar provision was granted to Ferdinand de Lesseps who then built the Suez Canal.) When Porfirio Díaz, who hailed from Oaxaca, rose to the Mexican presidency, he inaugurated the first operation of the Railway from the port of Santa Cruz, carrying sugar from Hawaii. Six years of success ensued: 850,000 tons of cargo traversed the isthmus.

Railway won: Mexico launched the first railway in 1850. More would follow. Image: Announcement of Mexico’s first railway, 1850. Public Domain.

But then, in 1914, disruptive new technology happened: the opening of the Panama Canal. Isthmus rail traffic plummeted by one third; the next year, by 77%. Panama was shorter (just 40 miles or 65 kilometers), easier, and more cost effective because cargo loaded on a ship could remain onboard the same vessel that would carry it on to global ports. As many as 32 -37 ships passed through the Panama Canal every day – in just 8 hours. The Panama Canal widened the route; container ships grew in size and capacity.

Panama Canal, NASA image, 2002. Public Domain.

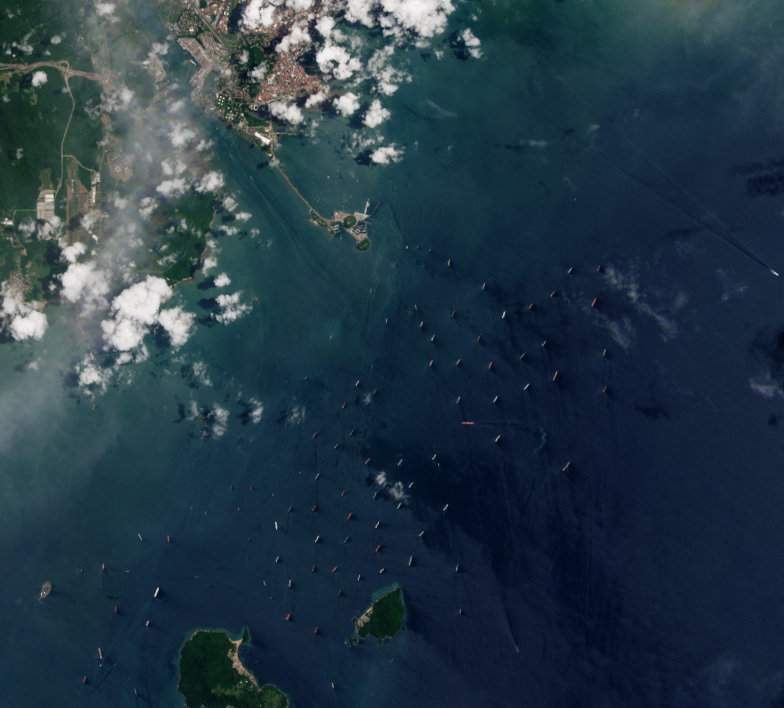
In 2023, a new situation threatened the Panama Canal: climate change. Drought threatens the region. The waterway, widened to accommodate ever-larger ships, may no longer support the heaviest behemoths. Limiting the number of ships per day began in 2023. If drought is severe, ships have to wait offshore for longer (and more expensive) periods; some buy their way up the line. Image below shows ships queuing up to traverse the Canal in 2023.

Enter Mexico. Observing an opportunity, the government began modernization of the Tehuantepec Railway and Oaxacan port of Salina Cruz. New tracks, re-laying of supportive basalt, advanced welding improved the railway. Construction of a breakwater outside the Salina Cruz strengthened the port. A new name was the cap that would announce a global vision: Corredor Multimodal Interoceánico (Interoceanic Multimodal Corridor). The railway is a centerpiece, both historic and futuristic. But much more is planned.

Railway is central but much more is planned. Image: Logo of Ferrocarril Interoceánico, CIIT, 2024. Public Domain.

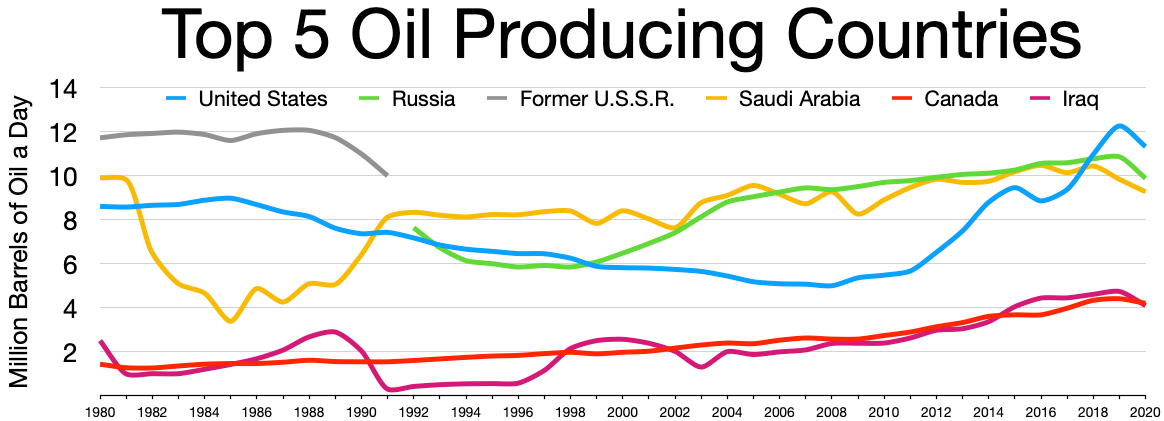
The project will include a trans-isthmus pipeline connecting the two ports. In response, Salina Cruz will host a liquified natural gas (LNG)  plant; that gas will then power ten new industrial parks. Businesses signing on will reap tax breaks for meeting job creation goals. Mexico’s commitment to natural gas expanded the network of pipelines nationally by 50% in the past decade; yet the South and Southeast receive less of that energy. Along with LNG, an existing oil refinery will turn residue into additional petroleum increasing the fossil fuel production by 70,000 barrels. In an area of the world were solar, wave, and wind may offer more environmentally sustainable opportunities, some question the direction of investment. But new partners like Copenhagen Infrastructure Partners will pursue green hydrogen, as well.

Some of the businesses moving to CIIT industrial parks may include those producing green hydrogen. Image: “NGC 604, ionized hydrogen in the Triangulum Galaxy” by Hui Yang, University of Illinois and NASA, 1995. Public Domain.

While a canal is not planned, cargo ships are invited to offload their cargo on the Pacific side, carry the containers across the railway stretch, and then re-load on the Atlantic side, probably to a partner vessel. With drought compromising the Panama Canal, Mexico may attract maritime shipping traffic, perhaps picking up 5% of Panama’s commerce. That would be a small percentage of a big number: in 2023, the Panama Canal’s revenues reached $4, 968 billion.

Zapotec civilization flourished in Oaxaca from 700bce – 1521ce. Zapotec culture and values remain strong. Here, Cocijo, Zapotec deity of water. Image: photograph by Yavidaxiu, 2011. Creative Commons 3.0. Included with appreciation.

In all of the activity initiated by the Corridor, as it is known in English, and its potential to offer opportunity to southern Mexico, not everyone is sanguine: the First Nation and indigenous communities have expressed concern. Zapotec leaders won a lawsuit protesting land purchase for one of the planned industrial parks. Land payments also troubled a Zapotec activist who had protested the distribution of the funds: when he was found dead, such violence raised more concern – and fear. Human rights violations began to be raised. Mixe community leaders blocked progress on their section of the Railway: arrested protestors were released in response to demands by the National Indigenous Council. Indigenous concerns include disturbance of agricultural soil health and biodiversity.

Mexico’s new President Claudia Sheinbaum, climate scientist, takes office 1 October 2024. Image: “President Elect Claudia Sheinbaum, 2 June 2024” by photographer EneasMx, 2024. Creative Commons 4.0. Included with appreciation.

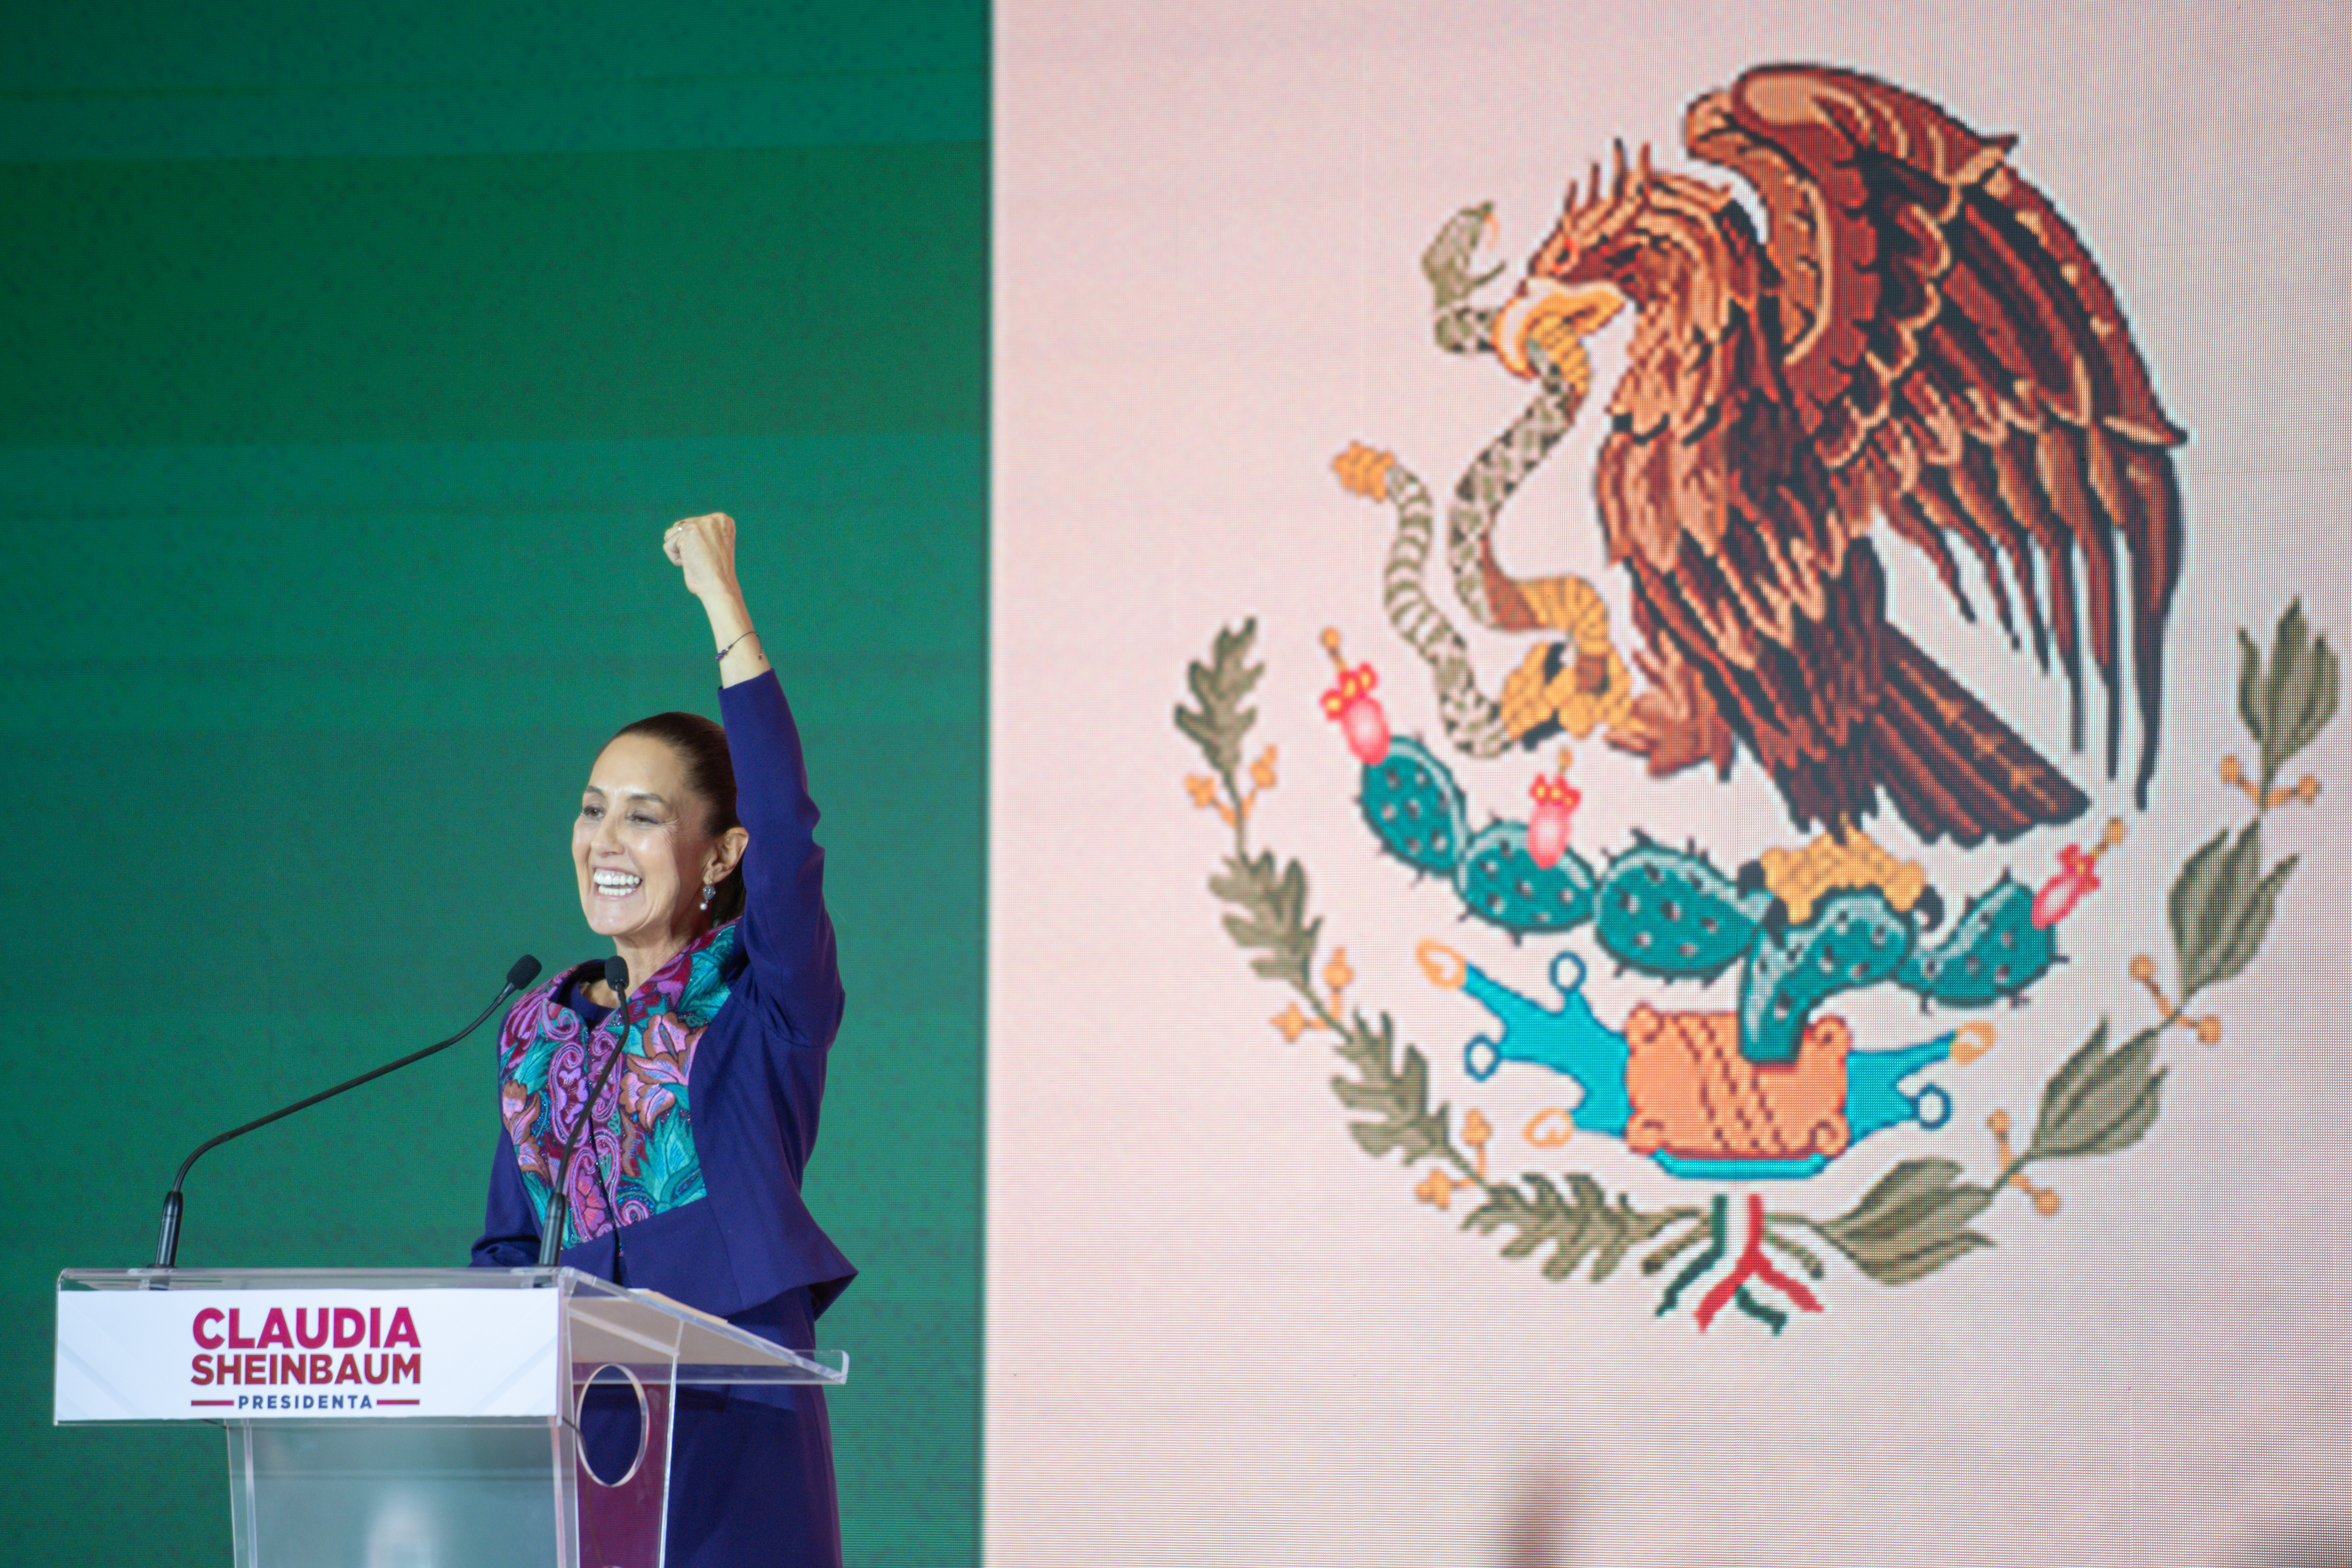
Geography, destiny, and climate change may speed the future of the Interoceanic Corridor of the Isthmus of Tehuantepec (CIIT). How will environmental scientist Claudia Sheinbaum, PhD, Mexico’s new president who begins a six-year term on 1 October 2024, work with Oaxaca, and its unique geographical and cultural gifts, to build Mexico’s future?

Bourke, India. “Claudia Sheinbaum: What a climate-scientist turned president might mean for global efforts to tackle climate change” 7 June 2024. BBC. https://www.bbc.com/future/article/20240607-claudia-sheinbaum-mexicos-new-climate-minded-president

Davidson, Frank P. and K. Lusk Brooke. “The Channel Tunnel: England and France,” Chapter 39, pages 761 – 804. Volume II. Building the World. Westport: Greenwood Press, 2006. ISBN: 978313333743.

Matheiros, Gabriel. “Panama Canal’s revenue up 14.9% in 2023 despite lower cargo.” 23 February 2024. Datamar News. https://www.datamarnews.com/noticias/panama-canals-revenue-up-14-9-in-2023-despite-lower-cargo/

Mexico, Government of. “DECRETO por el que se crea el organismo público descentralizado, con personalidad juridica y patrimonio propio, no sectorizado, denominado Corredor Interoceánico del Istmo de Tehuantepec.”14 June 2019. Diario Oficial de la Federación. https://dof.gob.mx/nota_detalle.php?codigo-5562774&fecha=14/06/2019#gsc.tab=0

Wall Street Journal. “Mexico’s Interoceanic Corridor.” 2024. VIDEO. https://www.youtube.com/watch?v=NMDCKpmc-uo

Appreciation to Charles E. Litwin for sharing research.

Building the World Blog by Kathleen Lusk Brooke and Zoe G. Quinn is licensed under a Creative Commons Attribution-NonCommercial-NoDerivs 3.0 U


Print Friendly, PDF & Email

ENERGY: Pipe Dream or Nightmare?

Fossil fuels like oil and gas are carried around the world by pipelines. Image: “Vortex street animation gif” by Cesareo de La Rosa Siqueira, 2006. Dedicated to the public domain, Creative Commons0 1.0, by the designer and included with appreciation.

Pipelines carry energy in a distribution system that is one of the most complex in the history of civilization. But the energy pipeline had humble beginnings. In 1821, William Hart of Fredonia, New York, saw something bubbling on the surface of Canadaway Creek. He ran home, grabbed his wife’s washtub, placed it over the bubbling area, drilled a small hole in the tub, stuck a barrel from an old gun (disconnected) and let the gas rise up. He’d seen kids playing around with the bubbles and lighting them on fire. So, when the gas bubbled out of his make-shift tube, he lit it: it burned.

William Hart discovered natural gas bubbling up from Canadaway Creek. He dug nearby and fashioned what may be one of the first energy pipelines. Image: “Canadaway Creek in New York” by photographer Schetm, 2022. This image is dedicated to the public domain, Creative Commons0 1.0. It is included with appreciation.

Realizing that this substance was a kind of fuel, Hart dug nearby, rewarded by a modest flow. Looking around for a few hollow logs that he could bind with rags and tar, Hart built a primitive pipeline and sold the energy source to a local tavern, perhaps giving new meaning to the bar quip “fire water.”

Image: “HDPE Pipeline in Australia” by photographer GordonJ86, 2013. This image is licensed under Creative Commons 4.0. It is included with appreciation.

Globally, there are so many energy pipelines that, if laid end to end, they could circle the globe 30 times. In the United States, there may be over 190,000 miles (approximately 305,000 kilometers) carrying crude oil from field to refinery to terminal. There are even more natural gas pipelines: 2.4 million miles (3.8 million kilometers). With all that volatile fuel coursing night and day, what could go wrong?

Image: “Pipeline Leak” photograph by U.S. Environmental Protection Agency, 1972. Image is from National Archives NWDNS-412-DA-3515. Public Domain and included with appreciation.

Fatigue can wear us all down: even more so for pipelines that never get to sleep or take a vacation. In April 2023, Canada’s TC Energy spilled 14,000 barrels of oil in Kansas, USA, because of a fatigue crack that began as a construction imperfection and gradually worsened until it spilled. As a result, the whole pipeline, normally conveying 622,000 barrels-per-day, shut down for three weeks. Mill Creek in Kansas suffered longer.

Nigeria suffered over 600 pipeline leaks in 2020. Image: “Nigeria as seen from space” by NASA, 2015. This image is licensed under Creative Commons 3.0 and is included with appreciation.

Unfortunately, pipeline leaks are not unusual. Nigeria suffered over 600 pipeline leaks in 2020. Every leak is deadly to wildlife, harmful to land and water, and costly. In four years (2015-2019), energy pipeline failures cost over $1 billion in property damage. What’s the remedy? While fossil fuel pipelines are still in use, detection and repair remain critical: half of the failures are due to corrosion.

Smart pigs are robotic devices traveling pipelines to detect cracks or leaks. Image: “Ancient drawing by unknown artist.” This fascinating image is in the public domain and included with appreciation.

Enter the “smart pig.” Invented in 1961 by Shell Development, this early form of mobile AI robotic devices launched commercially three years later by Tuboscope. How did “smart pigs” get their whimsical name? When first sent on a test mission, gears on the devices made a squealing sound that sounded like baby pigs. It is known that pigs are intelligent, and these devices certainly were, and are, smart.

Trans-Alaska Pipeline used smart pigs. Image: “Trans-Alaska Pipeline International” is licensed under Creative Commons 2.5 and is included with appreciation.

When Canada and the United States built the Trans-Alaska Pipeline, smart pigs were inserted into the infrastructure to measure flow and detect problems. Magnetic flux tools track metal loss: ultrasonic tools measure pipe wall thickness and look for cracks. Smart pigs enter via a “pig launcher” that then closes to let the pipe’s normal pressure carry it along, measuring and checking for problems, before arriving at a receiving station where it can be retrieved for data download. Pigs are not an afterthought to be deployed upon presentation of a problem: pipelines must be built to accommodate pigs before the energy system begins operation.

Line 5 affects the Chippewa, other Tribal nations who hold sacred the environment the pipeline traverses. Will the Alliance for Tribal Clean Energy guide the way? The U.S. States of Michigan and Wisconsin are also affected, and the lawsuits also Canada’s Enbridge. Image: “Flag of the Sokaogon Chippewa” by graphic designer Xasartha, 2014. Creative Commons 3.0, and included with appreciation.

Even when pipelines do not have technical problems, they cause legal problems. Transboundary issues are common: by definition, pipelines go the distance. For example, in the United States, “Line 5” traverses the lake bed of the Straits of Mackinac, a water passage connecting Lake Michigan and Lake Huron. Michigan, Wisconsin, and more than 20 Tribal Nations are affected. And then there’s Canada, where Enbridge, pipeline owner, receives 540,000 barrels of crude oil and natural (should we change the name to “methane gas?”) gas. The Tribal Nations raised concern bout their environment. The Wisconsin Chippewa filed a suit challenging the trespass on their land. Michigan opened a law suit concerning the section of Line 5 that traverses the Straits. There is now a judgement requiring Enbridge to reroute the pipeline and pay a $5 million fine (an appeal is in progress). Claiming Canadian rights granted by a 1977 treaty, Enbridge countered with an appeal and a proposal: they want to invade the Strait even more by building a tunnel made of concrete below the lake bed. While a pipeline may be difficult to remove, even more so a concrete tunnel.

How can we bridge a just transition from fossil fuels to renewable energy? Image: “Nénuphars et Pont japonais,” by Claude Monet 1899. This image is in the public domain and included with appreciation.

As we phase out coal, the world may continue to taper off oil and then, gas. In that transition, there are many issues of justice, environment, resource management, and transition strategy. Some energy advisors advocate keeping at least some fossil energy options available, as a bridge. Then, if a renewable energy source failed, and back-up energy storage also failed, we could “open the tap.” As Professor Emily Grubert warned, during a presentation at the Harvard Kennedy School in April 2024, in order to keep a system reliable, it has to be run periodically even when not needed. And, while we have tested the maximum flow volume for energy pipelines, have we yet tested the minimum? What is the right way to balance transition to renewable technology while still making sure there is backup? Phasing out fossil fuels may need more planning.

What can we do with all those pipelines? Image: “Animation of a capacitor using flow analogy in a pipe” by KDS4444, 2014. This image is licensed under Creative Commons 4.0, and included with appreciation.

As we free transition from fossil fuel sources, what will we do with all those pipelines: above ground, buried beneath, and those snaking lake and sea floor? Do you have ideas for reusing or repurposing pipeline infrastructure?

Alliance for Tribal Clean Energy. https://tribalcleanenergy.org

Baker, Michael Jr. Inc. and Raymond R. Fessler. “Pipeline Corrosion,” November 2009. Pipeline and Hazardous Materials Safety Administration, Office of Pipeline Safety, U.S. Department of Transportation. https://www.phmsa.dot.gov/sites/phmsa.dot.gov/files/docs/technical-resources/pipeline/gas-transmission-integrity-management/65341/finalreportpipelinecorrosion.pdf

Davidson, Frank P. and K. Lusk Brooke. “Trans-Alaska Pipeline,” Building the World, Volume Two, pages 681 – 709. Greenwood: 2006. ISBN: 0313333742. Note: contains the original contract for the pipeline.

Grubert, Emily. “Planning the Mid-transition for Just and Sustainable Decarbonization.” 1 April 2024. Harvard Kennedy School. Please see recording on Belfer Center YouTube.

Grubert, E and S. Hastings-Simon. 2022. “Designing the mid-transition: A review of medium-term challenges for coordinated decarbonization in the United States. WIRE’s Climate Change. https://wires.onlinelibrary.wiley.com/doi/abs/10.1002/wcc.768

Halleck, Rebecca and Dionne Searcey.  “A Great Lakes Pipeline Tangles Politics in Two Battleground States.” 27 March 2024. The New York Times. https://www.nytimes.com/2024/03/27/climate/line-5-pipeline-michigan-wisconsin-swing-stage.html

Hussein, Mohammed. “Mapping the world’s oil and gas pipelines.” 16 December 2021. Al Jazerra. https://www.aljazeera.com/news/2021/12/16/mapping-world-oil-gas-pipelines-interactive

Lacroix, Karine, et al., “Should it be called ‘natural gas’ or ‘methane’?” 1 December 2020. Climate Communication, Yale University. https://climatecommunication.yale.edu/publications/should-it-be-called-natural-gas-or-methane/

Lindner, Jannik. “Pipeline leak statistics.” 20 December 2023. https://gitnux.org/pipeline-leak-statistics/

Tuboscope. https://www.nov.com/about/our-business-units/tuboscope

Williams, Nia. “TC Energy says Keystone oil spill caused by fatigue crack,” 21 April 2023. Reuters. https://www.reuters.com/markets/commodities/tc-energy-receives-findings-root-cause-keystone-pipeline-oil-spill-2023-04-21/

U.S. Congress and Government of Canada. “Agreement Concerning Transit Pipelines,” 1977. https://www.congress.gov/treaty-document/95th-congress/6?s=1&r=22

U.S. Department of Transportation, Pipeline & Hazardous Materials Safety Administration, “Fact sheet: Inspections (smart pigs).” https://primis.phmsa.dot.gov/comm/factsheets/fssmartpig.htm

Building the World Blog by Kathleen Lusk Brooke and Zoe G. Quinn is licensed under a Creative Commons Attribution-NonCommercial-NoDerivs 3.0 U


Print Friendly, PDF & Email

TRANSPORT: Mobilizing the Future

Transport has evolved since the days of Ford and Edison. Image: “Automobiles over the years” by wikipedia.de, creative commons 2.5. Included with appreciation.

Henry Ford and Thomas Edison were both working, in 1912, on a new invention: the automobile. Edison’s was electric. Ford’s was powered by gasoline. What might the world look like today, if Edison’s design had prevailed?

Oslo, Norway, has achieved 30% reduction in emissions. Image: “Oslo at night” by Jørn Eriksson. Creative commons 2.0. Included with appreciation.

Norway might offer a preview. The Nordic country will stop selling gas-powered cars in two years. In 2022, over 80% of new cars sold were electric. Carbon emissions have declined by 30 percent in Oslo, Norway’s capital. The air is cleaner, the city is quieter. Government subsidized charging stations line the roads. The grid has not buckled; those formerly employed in fossil-fuel jobs have been able to transition. The only problem, so far, is an increase in tiny particles of pollution entering the air as a result of the friction of fast EVs and asphalt highways. When the United States Federal Highway System anticipates the increase in electric vehicles, perhaps the surface of roads, often renewed in the summer season, can be adjusted.

“Think City” car that may have started Norway on the road to low or zero transport emissions. Image: “Think City” by Mahlum, 2008. Donated by the photographer to the public domain. Included with appreciation.

Ironically, it was Henry Ford’s legacy that turned Norway towards electric vehicles several decades ago. Ford Motor Company collaborated on, and later acquired in the late 1990s/early 2000s, a car called “Think City” that captured the imagination of Norwegian motorists, in no small part because of policies including no import tax and no highway tolls. (Ewing 2023)

Norway’s network of pipelines is extensive. Image: Pipeline HDPE, Australia” by photographer Gordon J86, 2013. Creative commons 4.0. Included with appreciation.

Another irony: while Norway has pledged to reduce carbon dioxide emissions to a goal of zero (or close) by 2030, and electric vehicles are helping to reach that goal, Norway continues to drill for oil and gas. While Norway may be cleaner and greener, the country’s production of $180 billion worth of fossil fuels may see more exports. Russia-Ukraine conflict increased the need; Norway responded. Pipeline gas for Germany jumped 11%. Norway also sent gas to Belgium, France, Poland, and the UK. In 2028, Norway’s government plans to nationalize some Gassled pipelines. Norway’s network of gas pipelines rivals some countries’ highways: the pipes cover 5,600 miles (9,000 kilometers). By comparison, the Trans-Alaska Pipeline is 800 miles (1,287 kilometers) in length.

Norway leads the world in electric vehicle use. Image: “Plug-in electric cars in use as a proportion of all passenger cars on the road in selected countries and regional markets at the end of 2021” by Mariordo, 2022. Creative commons 4.0. Included with appreciation.

Meanwhile, 98% of Norway’s power generation comes from renewable energy, predominantly hydroelectricity. But transport has been a challenge. Norway introduced a National Transportation Plan (2018-2029) requiring all new ferries to use low emission technology, and all new cars and vans to be electric, all new city buses  to be fueled by biogas. (Sweco 2023) With a focus on the transport sector, ports will also be designed as energy centers where ships may power up with a mix of biogas, hydrogen, and electricity. Because transport accounts for 60% of Norway’s carbon emissions, and the Nordic nation has set a plan for zero (or low) emissions, the world may get a preview of the track to mobilizing the future.

“Animated GIF showing the Speed Dreams track system from a car’s point of view.” by Ocirne94, 2012. Public Domain. Included with appreciation.

Buli, Nora. “Norway piped gas exports rise 3.3% in 2022, set record for Germany” 23 January 2023. Reuters. https://www.reuters.com/business/energy/norway-piped-gas-exports-rise-33-2022-fall-just-shy-record-2023-01-23/

Ewing, Jack. ‘In Norway, the Electric Vehicle Future Has Already Arrived” 10 May 2023. The New York Times. https://www.nytimes.com/2023/05/08/business/energy-environment/norway-electric-vehicles.html?smid=nytcore-ios-share&referringSource=articleShare

Litwin, George H., John J. Bray, K. Lusk Brooke. Mobilizing the Organization: Bringing Strategy to Life. London: Prentice Hall, 1996. ISBN: 0131488910

Sweco. “Report: Race to Electrification – Norway in a Pole Position.” https://www.swecogroup.com/urban-insight/energy/report-race-to-electrification-norway-in-a-pole-position/

Building the World Blog by Kathleen Lusk Brooke and Zoe G. Quinn is licensed under a Creative Commons Attribution-NonCommercial-NoDerivs 3.0 U

Print Friendly, PDF & Email

CITIES: Cheesy fries – fuel of the future?

One of the joys of city living is availability and variety of take-out food. From cheesy fries to pizza by the slice, urban snacks are legendary. But most of these treats come in plastic containers that eventually end up in landfills.

“Chili cheese fries served in a foam containers with a plastic fork.” Photograph by Charles Severance. Creative Commons 2.0. Included with appreciation.
“Landfill” by Michelle Arseneault. Creative commons 3.0. Included with appreciation.

Cities are filled with discarded plastic, from single-use containers to bottled water. Every year, 400,000,000 tons of plastic are produced; that’s equivalent the weight of all the people on the planet.

Every year, the amount of new plastic produced is equivalent to the weight of all the people on the planet. Photo: “London’s Liverpool Street Station” by photographer Roger Carvell, 2012. Creative Commons 3.0 Included with appreciation.

Only 15% of plastic is recycled; most sits in urban landfills. One of the world’s largest landfills is the Apex Regional in Las Vegas, Nevada, not far from the Colorado River and Hoover Dam, stretching over 2,000 acres. Apex is filled with take-out food containers and many other kinds of plastic.

Apex Landfill near Las Vegas, Nevada, is one of the world’s largest. Image: “Las Vegas Skyline at night North,” by Curimedia. Creative Commons 2.0 Included with appreciation.

Time (and money) at slot machines may go fast, but landfill plastics have a long life. Plastic is designed to be durable. It degrades very slowly; it can take over 1,000 years. Even if we pull plastics out of landfills, not all are recyclable. Plastics containing even a bit of food (take-out fries, plastic forks) are not recyclable. And most people who toss food containers into trash, or even into recycling bins, do not, or cannot, wash them first.

What if landfill plastic, especially food containers, were actually buried treasure?ReisnerLab at Cambridge University may have found a way to turn discarded plastic into fuel; the process is powered by sunlight, and produces syngas. Much syngas currently produced requires non-renewable energy, but the ReisnerLab process uses solar. Another benefit? Cambridge University’s nascent system can handle recycled plastic with food waste stuck to the containers. It’s a problem for most recycling, but the Cambridge system uses the leftover food as a substrate, making the process work even better. ReisnerLab’s innovation is at an early stage, and shows promise. Some investors tracking developing innovation may take note.

Syngas can use the same infrastructure but is cleaner than traditional fossil fuels. Image: “Pumping Gas” by photographer Airman 1st Class Lee. Photographed at Vandenberg Airforce Military Base, 2009. Public Domain. Included with appreciation.

Benefit of syngas – it can be pumped. Professor Erwin Reisner observes that “effectively plastic is another form of fossil fuel, rich in energy.” Unlocking that energy to use as fuel could replace traditional fossil fuels and yet not pose the extent of pollution and emission problems caused by coal, oil, and gas. Being able to use the same distribution and delivery infrastructure, plastic-produced syngas could be helpful in fueling the future. One of the difficulties that slows down energy transition is switching to new delivery and distribution systems from existing infrastructure. Re-using gas pipelines, delivery trucks, pumps, and hoses for syngas is a great advantage. And getting rid of food-coated un-recyclable plastic clogging city landfills? A bet as good as Las Vegas.

Biofuel. “What is Syngas?” https://biofuel.org,uk/index.php?p=what-is-syngas

Bhattacharjee, Subhajit, Motiar Rahaman, Erwin Reisner. “Photoelectrochemical CO2-to-fuel-conversion with simultaneous plastic reforming.” 9 January 2023. Nature Synthesis 2, 182-192, 2023. https://www.nature.com/articles/s44160-022-00196-0

Reisner Lab. http:/www-reisner.ch.cam.ac.uk/research.html

Building the World Blog by Kathleen Lusk Brooke and Zoe G. Quinn is licensed under a Creative Commons Attribution-NonCommercial-NoDerivs 3.0 Un

Print Friendly, PDF & Email

ENERGY: Hydrogen windfall

Water flowing over iron rock releases hydrogen. The process takes place in Earth’s crust. Image: “Waterfall” Alps, by Jiri Bubenicek. Creative Commons 4.0. Included with appreciation.

Water is the most abundant element not just on Earth but in the universe. Water contains hydrogen – an energy source that is not only powerful (think rocket fuel) but clean: when you burn it, the only emission is water, because water is H2O.

Water is H2O. Image: “Water Molecule,” by Booyabazooka, 2006. Dedicated by the artist to the public domain, CCO 1.0, and included with appreciation.

In the quest for clean energy, hydrogen has not quite led the pack because it is currently produced in ways that are not so clean. We can generate hydrogen from water, but that process takes a lot of electricity. We can generate hydrogen from methane, but CO2 escapes.

Graphic of industrial process showing inputs into electrolysis to produce one ton of hydrogen and other outputs. By Parent55, 2020. Dedicated by the artist to the public domain, CCO 1.0, and included with appreciation.

Now, geologists and scientists may have found a way to access hydrogen in the same way we now drill for oil. There is hydrogen in the Earth’s crust. Some estimates indicate millions of megatons of hydrogen. It is true that, for distribution, hydrogen would have to be liquified to flow through conduits like the Alaska pipeline: there are some problems with that approach, but proposals to mix it with other substances might work. Another option is compression. The great benefit from mined hydrogen is that we could use the same equipment we already have, the same technologies, the same trained specialists. The fossil fuel industry’s existing infrastructure would be reused, renewed, and reborn.

“An elevated section of the Alaska Pipeline” 2007. U.S. Department of Transportation Public Domain. Included with appreciation.

Hydrogen may be the ultimate renewable energy. Geologists find that hydrogen is constantly being generated by Earth’s normal interaction of water with iron-laden rock. As water flows past rock, iron grabs the oxygen and the result is hydrogen. That’s why hydrogen may always be renewing through Earth’s natural processes.

“Banded iron formation at Dales Gorge, Karijini National Park, Western Australia,” 2013, by photographer Graeme Churchard. Creative commons 2.0. Included with appreciation.

And, also, good news for NASA. Because water and iron-rock are present in other areas of the universe, like planets and asteroids, hydrogen may be accessible in space.

“The Celestial Zoo” by Pablo Carlos Budassi, 2022. Infographic listing 210 notable astronomical objects on a central logarithmic map of the observable universe. Wikimedia commons 4.0. Included with appreciation.

Hydrogen formed by Earth’s interaction of water and rock is as old as waterfalls and aquifers and as new as rockets. We may be standing on the ultimate source of renewing the world.

Image by Caleb Ralston, 2015. Dedicated to the public domain CCO 1.0 by the photographer; included with appreciation.

Coy, Peter. “A Gold Mine of Clean Energy May Be Hiding Under Our Feet.” 27 February 2023. The New York Times. https://www.nytimes.com/2023/02/27/opinion/hydrogen-natural-climate-change.html?smid=nytcore-ios-share&referringSource=articleShare

Ellis, Geoffrey, and Sarah E. Gelman. “A preliminary model of global subsurface natural hydrogen resource potential.” 12 October 2022. Geological Society of America. Paper: 215-5.  Geological Society of America Abstracts with Programs, Volume 54, No. 5, 2022. doi: 10.1130/abs/2022AM-380270. https://gsa.confex.com/gsa/2022AM/meetingapp.cgi/Person/266148

Building the World Blog by Kathleen Lusk Brooke and Zoe G. Quinn is licensed under a Creative Commons Attribution-NonCommercial-NoDerivs 3.0 Un

Print Friendly, PDF & Email

ENERGY: Cutting down on Flare ups

“North Dakota Flaring of Gas, Bakken Formation,” by Joshua Doubek, 2012. Creative Commons 3.0, wikimedia. Included with appreciation.

Shooting carbon dioxide into the atmosphere – as a matter of convenience? Drilling for oil releases gas, a side effect. In many drilling locations, gas is just burnt off to get rid of it quickly; this practice is so common that it is called “routine flaring.” In a few instances, gas build-up is sudden and severe, so it must be flared to avert explosion; this is called “safety flaring.”

Flaring is such a common practice that there are more than 10,000 gas flares active at any time. Flaring is harmful – in 2021, it sent 144 billion cubic meters into the atmosphere with a carbon dioxide input of 400 million tons – this is the same as 9 trillion miles of automobile rides.

Flaring causes emissions equivalent to 9 trillion miles of automobile rides. Image: “Driving cars n a traffic jam,” by epSOs.de, 2011. Creative commons 2.0, wikimedia. Included with appreciation.

Flaring sends more than carbon dioxide into the air; it also yields soot, or technically black carbon. According to the European Geoscience Union, 40% of the black carbon in the Arctic comes from gas flaring. Arctic ice cap melting increased because someone in a far-away oil field flared rather than saved gas. Flaring also sends other substances into the air: benzene – known to cause cancer; naphthalene, linked to eye and liver damage.

Who’s to blame? Algeria, Iran, Iraq, Nigeria, Russia, the USA, and Venezuela flared the most gas over the last decade, but now China, Libya, and Mexico have started flaring. Gas flared and lost in 2021 could have powered all of sub-Saharan Africa.

“Sub-Saharan Africa, as defined by United Nations.” Design by Jcherlet, 2010. Wikimedia. Included with appreciation.

Why not just stop flaring, as the World Bank’s Zero Routine Flaring Scheme (ZRF) proposes? The Scheme, introduced in 2015, now has 54 energy companies, and 32 national governments as supporters. There has been some progress. Norway taxes gas flaring; as a result, it has the lowest flaring rate. Kazakhstan introduced incentives in the local gas market that encouraged drillers to capture and sell gas, reducing flaring in the process.

Cost remains a factor: stopping routine flaring would cost an aggregate $100 billion. Why not just capture it and reuse it, or sell it? There are processing costs to remove some chemicals before the gas can be used. But the gas would be suitable for powering drilling sites, or perhaps useful for mobile electricity generation in the field. In the field, unwanted gas could be returned to the land rather than flared into the air. In fact, injecting the gas into the ground would raise pressure and in turn allow better flow of oil. Finally, gas might be treated to deliver to energy pipelines.

Pipelines circle the Earth: could gas, not flared but collected and treated, join the flow? Image: “West Coast Pipeline,” by DarrenBaker, 2005. Creative Commons, wikimedia. Included with appreciation.

Pipelines, like the Alaska Pipeline or West Coast Energy Pipeline, are ubiquitous: in December 2020, there were 2,381 oil and gas pipelines in 162 countries – the combined pipelines’ total length is enough to circle the globe 30 times. On drilling sites where gas is now flared, could ancillary supply lines conveying gas collected and treated, instead of flared, join that circle?

BBC, Science & Environment. “Gas flaring: What is it and why is it a problem?” 29 September 2022. https://www.bbc.co.uk/news/science-environment-63051458

Hussein, Mohammed. “Mapping the World’s Oil and Gas Pipelines.” 15 December 2021. Aljazeera. https://www.aljazeera.com/news/2021/12/16/mapping-world-oil-gas-pipelines-interactive

Puliti, Riccardo. “Boost energy security and cut methane emissions by reducing gas flaring and venting.” 6 October 2022. World Bank Blog. https://blogs.worldbank.org/voices/boost-energy-security-and-cut-methane-emissions-reducing-gas-flaring-and-venting

World Bank. “Zero Routine Flaring by 2030 (ZRF)” https://www.worldbank.org/en/programs/zero-routine-flaring-by-2030

Building the World Blog by Kathleen Lusk Brooke and Zoe G. Quinn is licensed under a Creative Commons Attribution-NonCommercial-NoDerivs 3.0 Un

Print Friendly, PDF & Email

ENERGY: Aloha


“Waikiki Beach, Diamond Head, Oahu,” by D. Howard Hitchcock, Hawaii 1928. Image: wikimedia in the public domain. Included with appreciation to D. Howard Hitchcock.

Aloha means both hello and goodbye. It’s a fitting word for transitions. Here are two case examples of solar policy changes in Hawaii and in Australia.

Hawaii is a perfect location for renewable energy: sunshine and wind are abundant. Yet, even with its natural advantages of sun and wind, Hawaii has been slow to move away from fossil fuels. But when electricity rates increased by 34% (from April 2021 to April 2022), homeowners who pay those hiked rates began to install solar. Now, more than one-third of all residential buildings in Hawaii have solar roofs. Could Hawaii serve as a case example of the challenges, and paths, to transitioning from fossil to renewable energy?

“Hawaii solar: a photovoltaic power station.” by photographer Reegan Moen, U.S. Department of Energy, 2017. Wikimedia public domain. Included with appreciation to Reegan Moen and U.S. Department of Energy.

Policy matters. Just a few years ago, Hawaiian Electric, the largest power provider in the island state, lobbied to reduce rebates for rooftop solar. In 2015, utilities slashed revenues for excess energy sent to the grid by homeowners. But Hawaii has changed policies now, offering incentives up to $4,000 for Oahu residents to install home batteries for solar systems: the utilities now siphon excess power between 6pm – 8:30 pm, when demand peaks. Policy has encouraged solar adoption: legislating a Performance Based Regulation (PBR) for Hawaiian Electric now makes renewable sources easier to adopt and link, further aiding homeowners in their rooftop systems. Kauai has made the most progress: 70% of the island’s electricity is carbon-free and expected to increase to 90% with more solar and a hydroelectric plant that both creates and stores energy.

How will geopolitics hasten the clean energy transition? “Top Oil Producing Countries,” by U.S. Department of Energy, 2022. Image: wikimedia, public domain. Included with appreciation.

Geopolitics recently hastened the transition. In 2021, oil-supplied power plants delivered two-thirds of Hawaii’s electricity. Most of that oil (80%) was imported from Russia (as well as Argentina and Libya), while 20% was obtained from Alaska. Further, Hawaii is about to close its major coal plant. Forces of war and threats to supply have turned Hawaii in the direction of the sun. There is still debate over what kind of solar is best: utilities prefer large-scale options; but macro-scale means large tracts of land, something Hawaii does not have in abundance. Hawaii has set a new goal to achieve 100% renewable energy sources: it is the first American state to do so. Recently, other states have set the same goal. Cities are making solar decisions ahead of states. Hawaii’s Honolulu has three solar panels per person; California’s Los Angeles ranked number one of 57 cities surveyed for total installed solar capacity in 2019, while Nevada’s Las Vegas is close behind. In 2019, more solar capacity was added to the U.S. grid than any other energy source.

“The Famous Bondi Beach, Australia,” by photographer Alex Proimos, 2012. Image: creative commons 2.0. Included with appreciation to Alex Proimos.

Another place in the sun? Bondi Beach, Australia, home of  Snowy Mountains Hydroelectric.  Australia drew 76% of its total energy from fossil fuels in 2020 with a mix of coal (54%), gas (20%), and oil (2%). Australia plans to close its largest coal plant in 2025 (seven years earlier than scheduled) and is now picking up the pace in solar. Australia increased rooftop solar installations by 28% from 2019 to 2020 – one in four homes there have solar panels: incentives and grants, contributed to the change. By 2020, renewable energy reached 24% of Australia’s power array. How much did the Renewable Energy (Electricity) Act of 2000 accelerate the change? Will the 2022 election of a new Australian government advance climate action?

“Sunlight on the face of Earth,” by NASA Earth Polychromatic Imaging Camera (EPIC) that tracks sunlight , from Deep Space Climate Observatory (DSCOVR)” by NASA 2017. Image: wikimedia public domain. With appreciation to NASA.

Hawaii and Australia may serve as examples of how natural resources like sun and wind interact with policy and geopolitics in a dynamic system influencing factors driving the transition from fossil fuels to renewable energy. What kinds of laws and policies are needed to encourage change?

Australia, Federal Register of Legislation. “Renewable Energy (Electricity) Act 2000.” C2019C00061. https://www.legislation.gov.au/Details/C2019C00061/Html/Text

Australian Government of Industry, Science, Energy, and Resources. “Australian electricity generation – fuel mix.” 2020. https://www.legislation.gov.au/Details/C2019C00061/Html/Text

Environment America Research and Policy Center, and Frontier Group. “Shining Cities 2020: The Top U.S. Cities for Solar Energy.” 2020. https://environmentamerica.org/feature/ame/shining-cities-2020

Harlow, Casey. “Honolulu tops national list for solar energy generation.” 19 April 2022. Hawaii Public Radio. https://www.hawaiippublicradio.org/local-news/2022-04-19/honolulu-tops-national-list-for-solar-energy-generation

Hawaii Public Utilities Commission (PUC). “Performance Based Regulation (PBR).” Decision and Order No 37787, 17 May 2021. https://puc.hawaii.gov/energy/pbr/

Paul, Sonali. “Australia’s biggest coal-fired power plant to shut in 2025.” 16 February 2022. Reuters. https://www.reuters.com/business/energy/origin-shut-australias-biggest-coal-fired-power-plant-225-2022-02-16/

Penn, Ivan. “Hit Hard by High Energy Costs, Hawaii Looks to the Sun.” 30 May 2022. The New York Times.

Building the World Blog by Kathleen Lusk Brooke and Zoe G. Quinn is licensed under a Creative Commons Attribution-NonCommercial-NoDerivs 3.0 Un

Print Friendly, PDF & Email

ENERGY: Sustainability – natural and geopolitical

“Ukraine animated flat.” by Zscout370. CC 3.0. Image: wikimedia.

The crisis in Ukraine has tragic consequences for people and country, but also reveals something else of concern to peace: energy and geopolitical sustainability. While science has made it clear that climate change is driven by energy choices, transitioning from fossil fuels will be a challenge in the best of circumstances. But recent world events remind us of another factor in energy strategy: geopolitical sustainability.

What can the Suez Canal teach us about strategic assets in times of peace, and times of war? “Suez Canal” satellite photo by NASA, 2001. Public domain. Wikimedia.

Geopolitics emerged as an economic factor during the Suez Canal crisis of 1959. When the matter was resolved, by a team led by Jean-Paul Calon, the Suez Canal Company became one of the leading financial investment houses. Suez reveals the importance of who controls strategic assets in times of peace, and in times of war. Another case study: the energy crisis of 1973 when the OPEC declared an oil embargo: by 1974, oil prices rose by 300%. What can those lessons teach us today?

“Russia’s petrolem regions.” by Historicair, 2007. Creative Commons 3.0. Image: wikimedia.

Russia supplies 40% of Europe’s natural gas (Poitiers 2022). Some experts recommend that this is the time for the EU to support more energy-vulnerable members, and to restructure the continent’s energy system. In other market areas, there is a significant difference. Russia exports more than half its market output to Europe; but the EU sends just 5% of its exports to Russia. The EU’s market economy is ten times greater than Russia’s. But the figures in energy look very different. Various EU states have differing exposures. For example, here are figures for reliance upon Russian natural gas:

Bulgaria: 100%

Poland: 80%

Austria, Hungary, Slovenia, Slovakia:  60%

Germany: 50%

Italy: 40%

Belgium, France, Netherlands: 10%

Spain, Portugal: 0%

Source: Poitiers et al., 2022

European gas reserves are currently 1/3 full. But that relatively comforting news is countered by gas prices: on February 24 when Russian troops crossed the Ukraine border, gas prices in the EU skyrocketed by 60%.  Some help may come from Qatar and the United States; Japan and South Korea could send some supplies. But many supply lines are already maxed out: Algeria and Norway are producing and exporting at capacity. Pipelines are under threat. If the Netherlands upped their natural gas exploitation, there is the danger of increased seismic vulnerability. What are the alternatives until we can transition fully to renewable energy? Who has reserves?

“Countries with Natural Gas Reserves: 2014: Russia has the largest reserves” by Ali Zifan, who has dedicated this work to the public domain, CC0 1.0. Image: wikimedia.

In planning a transition from fossil fuels, we need a global redrawing of the energy supply chain. UK Prime Minister Boris Johnson called for a new energy vision with strategic withdrawal from Russian oil and gas (the UK gets only 5% of its gas from Russia) but Germany’s Chancellor Olaf Scholz advocated exempting Russian energy from sanctions. (BBC 2022). Meanwhile, the United States announced new policy on Russian coal, gas, and oil. With Ukraine crisis, most serious in humanitarian and democratic concerns, there have been effects on regional and global energy, as well. Russia is the largest producer of crude oil, after Saudi Arabia. This week, oil prices rose to $139 per barrel – a high of 14 years. Will the Ukraine crisis cause a redesign of world energy and accelerate the transition to an energy system sustainable not only in resources but also in geopolitics? Climate change is cited by many as a pressing reason to transition to renewable energy. But the deprivation, suffering, tragedy of war now bring this issue to a painful urgency. Could the current crisis and war lead to a new era of energy with a renewed commitment to peace?

Barsky, Robert B. and Kilian, Lutz. “Oil and the Macroeconomy since the 1970s” The Journal of Economic Perspectives. 18 (#4): 115-134. doi: 10.1257/0895330042632708

Biden, Joseph R.,President. “Announcement of U.S. Sanctions on Russian Energy,” 8 March 2022, White House.gov. VIDEO: https://youtu.be/G7Kr1tHmEP0

Davidson, F. P. and K. Lusk Brooke. Building the World. Volume One, Chapter 16, pages 187-204. Greenwood/ABC-CLIO/Bloomsbury, 2006. ISBN: 0313333734.

Houser, Trevor, et al., “US Policy Options to Reduce Russian Energy Dependence.” 8 March 2022. Rhodium Group. https://rhg.com/research/us-policy-russia-energy-dependence/

Johnson, Boris as quoted in “Ukraine war: PM calls for ‘step-by-step’ move from Russian fuel.” BBC. 7 March 2022.

Krauss, Clifford. “Loss of Russian Oil Leaves a Void Not Easily Filled, Straining Market.” 9 March 2022. New York Times. https://www.nytimes.com/2022/03/09/business/energy-environment/russia-oil-global-economy.html?referringSource=articleShare

Poitiers, Niclas et al., “The Kremlin’s Gas Wars: How Europe Can Protect Itself from Russian Blackmail.” 27 February 2022. Foreign Affairs. https://www.foreignaffairs.com/articles/russian-federation/2022-02-27/kremlins-gas-wars

Reed, Stanley. “Burned by Russia, Poland Turns to U.S. for Natural Gas and Energy Security.” 26 February 2019. New York Times. https://www.nytimes.com/2019/02/26/business/poland-gas-ing-russia-use.html?referringSource=articleShare

Upadhyay, Rakesh. “The 5 Biggest Strategic Petroleum Reserves in the World,” 29 March 2017. oilprice.com. https://oilprice.com/Energy/Energy-General/The-5-Biggest-Strategic-Petroleum-Reserves-in-The-World.html

Building the World Blog by Kathleen Lusk Brooke and Zoe G. Quinn is licensed under a Creative Commons Attribution-NonCommercial-NoDerivs 3.0 Un


Print Friendly, PDF & Email

ENERGY: Arctic Refuge

“Arctic National Wildlife Refuge.” Photograph by Steven Chase, US Fish and Wildlife Service. Image: wikimedia commons.

US Arctic National Wildlife Refuge will keep its mission as a refuge, at least for now. Leases to drill for gas and oil have been suspended, pending review. This follows cancellation of the Keystone XL pipeline, on 20 January 2021. When the Alaska Highway was built, and later the Trans-Alaska pipeline, it was a matter of war and then of preservation of another kind. But the Arctic National Wildlife Refuge (ANWR) covers 19.6 million acres including the Mollie Beattie Wilderness. It is the second largest wilderness area in the US, and contains 1 million acres of coastal plains. Coasts are attractive as access points for ships and drilling operations. But coasts are also critical for habitat, and already of concern for rising seas.

“Arctic National Wildlife Refuge.” Image: wikimedia commons.

Mollie Beattie, conservationist and former director of the United States Fish and Wildlife Service (the first woman to head the agency), once said: In the long term, the economy and the environment are the same thing. If it’s un-environmental, it is un-economical. That is the rule of nature.

Alaska Wilderness League. “Arctic Refuge.” https://www.alaskawild.org/places-we-protect/arctic-refuge/

Gup, Ted. “Woman of the Woods – Mollie Beattie, a Natural as Fish and Wildlife Chief,” Washington Post. https://web.archive/org/web/20050306030214/http://www.esew.org/mollieb.htm

Harwood, John and Liz Stark. “Biden administration to suspend oil and gas drilling leases in Arctic refuge, undoing a Trump-era decision.” 1 June 2021. CNN. https://www.cnn.com/2021/06/01/politics/oil-and-gas-arctic-leaders/index.html

Building the World Blog by Kathleen Lusk Brooke and Zoe G. Quinn is licensed under a Creative Commons Attribution-NonCommercial-NoDerivs 3.0 Unp

Print Friendly, PDF & Email

WATER: Self-healing systems

Self-healing water systems: rebuilding water. Image: water pipes, wikimedia commona.

Houston is rebuilding. A severe winter storm knocked out power, in February, leaving families and businesses huddled for elusive warmth. The Electric Reliability Council of Texas (ERCOT), supplier to 26 million people, proved not as reliable as its name. Collateral damage from the power outage: water problems. In the cold snap, water pipes cracked, causing water contamination and outages. Houston’s mayor admitted pipes were not insulated, also the case with power plants: disaster was foreseeable: “Our system in Texas is designed primarily for the summer heat, and not necessarily for a winter event. The reality is climate change is real, it is real, and these major storms can happen at any time.” (Turner 2021) Houston will have to rebuild its water system. United States’ declaration of disaster released federal funds. Rebuilding offers a chance not just to restore but to rethink. Could new technologies for self-healing systems offer options?

“Platelets.” Tieroardi 2005. wikimedia.

Self-healing pipes are inspired by human biology. When we experience a cut on the body’s skin, blood comes to the surface and then clots. It’s the work of platelets. That is what inspired engineer Ian McEwan of the University of Aberdeen, and now Scotland’s Brinker Technology to develop “artificial platelets” made from elastomeric material that can be injected into pipelines. When a leak occurs, the pressure change conveys the platelets to the leak, and they clog it. developed for pipelines carrying fuel and tested by British Petroleum and Shell, be adapted for municipal water systems? The method is currently being adapted to use in water pipes in the United Kingdom (UK) where 3,600 million liters of water leak out of pipes every day, causing water companies to repair by digging and replacing water pipes.

“Eielson Air Force Base, Aurora Borealis over Bear Lake.” Image: wikimedia

The Alaska Pipeline, completed in 1977, carries a different liquid; pipes are half buried underground and half above on elevated supports: a design innovation due to permafrost. Through the pipes are “smart pigs,”a playful name for serious devices housed in pipe interiors. If corrosion or leaks occur, smart pigs send a signal warning of disaster before it happens.

Water Use Map of USA. Image wikimedia

America is rebuilding. The United States has over a million miles of water supply mains – equal to 26 miles of water mains for every mile in the US federal highway system. It’s an old system: US pipes leak a full day’s water for every seven days, losing one of every seven gallons of drinking water. (Fishman 2014) Worldwide, 600 million people lack access to safe drinking water sources and systems. United Nations’ Sustainable Development Goal on water and sanitation urges safe access for all by 2030. As we address water access for all, installing new plumbing for some areas and rebuilding older systems in others, can we utilize smarter, self-diagnosing, self-healing water delivery systems?

Al Jazeera. Interview with Houston, Texas Mayor Sylvester Turner. “Texas disaster ‘foreseeable and preventable,’ Houston Mayor says.” 21 February 2021. https://www.aljazeera.com/news/2021/2/21/texas-disaster-foreseeable-and-preventage-houston-major-says

American Society of Civil Engineers. “Drinking Water: Infrastructure Report Card, 2017.” https://www.infrastructurereportcard.org/cat-item/drinking_water/

Davidson, Frank P. and Kathleen Lusk Brooke. “The Trans-Alaska Pipeline: United States and Canada.” Building the World, Volume II, pages 681-709. ISBN: 0313333742.

Fishman, Charles. “13 Things You Probably Don’t Know About the U.S. Water System (But Should)” 14 August 2014. National Geographic. https://blog.nationalgeographic.org/2014/08/12/13-things-you-probably-dont-know-about-the-u-s-water-system-but-should/

Graham-Rowe, Duncan. “Self-Healing Pipelines.” 21 December 2006. Technology Review. https://www.technologyreview.com/2006/12/21/130692/self-healing-pipelines/

Fluence. “Aging Water Infrastructure in the US.” 31 May 2018. Fluence News. https://www.fluencecorp.com/aging-water-infrastructure-in-the-us/

Hares, Sophie. “The cost of clean water: $150 billion a year, says World Bank.” 28 August 2017. Thomas Reuters Foundation. https://www.reuters.com/article/us-global-water-health-idUSKCN1B812E

Homer, Michelle. “City of Houston issues boil water notice.” 17 February 2021. KHOU-11. https://www.khou.com/article/news/local/city-of-houston-issues-boil-water-notice/285-1610aabc-1d48-4040-833c-45aaf572c721

White House. “President Joseph R. Biden, Jr. Approves Texas Disaster Declaration.” 20 February 2021. https://www.whitehouse.gov/briefing-room/statements-releases/2021/02/20/president-joseph-r-biden-jr-approves-texas-disaster-declaration/

World Bank Group. “Water Supply.” 23 June 2017. https://www.worldbank.org/en/topic/watersupply

Building the World Blog by Kathleen Lusk Brooke and Zoe G. Quinn is licensed under a Creative Commons Attribution-NonCommercial-NoDerivs 3.0 Unp

Print Friendly, PDF & Email