CITIES: Labor and Workers’ Rights

Los Angeles, with the Hollywood sign overlooking the city, is the home of many striking actors of SAG-AFTRA seeking better rights. Image: “Hollywood Sign” by photographer Thomas Wolf. Creative Commons 3.0 Included with appreciation.

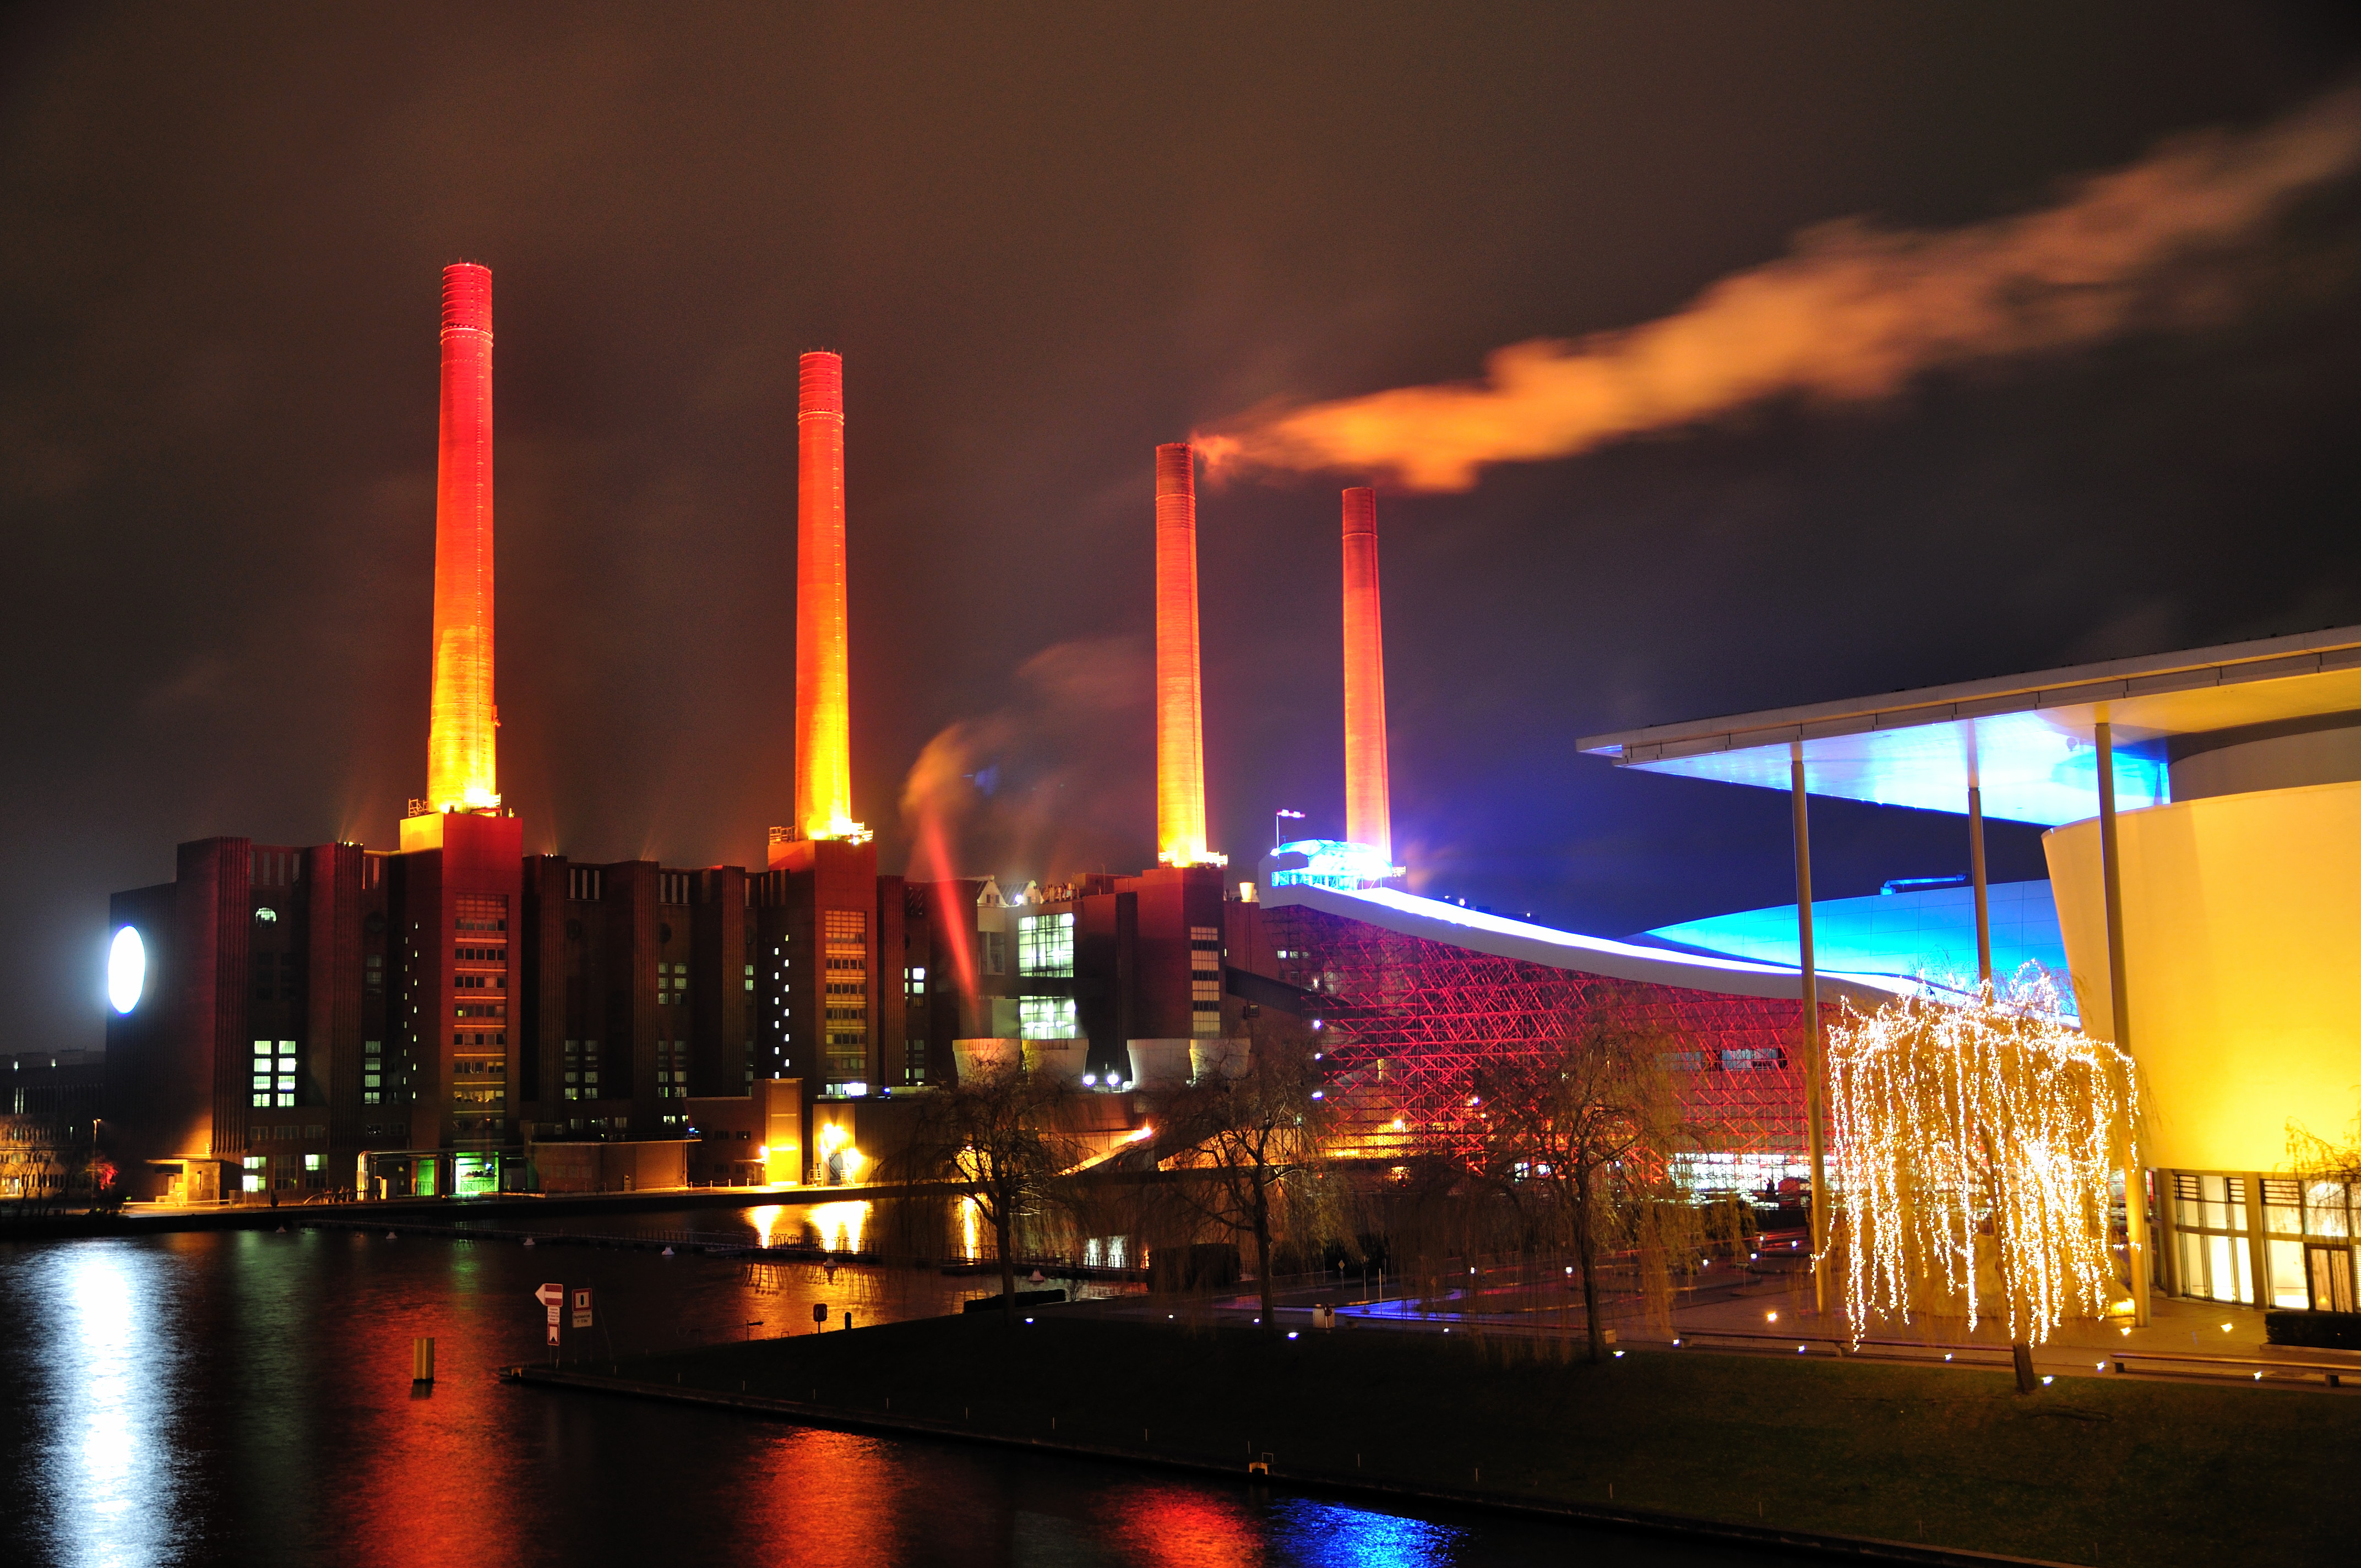
Human history may be traced in the move from field to city, from local farm to industrial agriculture, and with that – from indentured field serf to urban worker. Some sociologists say that human history is the history of cities. Cities may also be the birthplace of human, and worker, rights. An example: Wolfsburg, Germany, began as the Duchy of Magdeburg, then became the Stadt des KdF-Wagnes bei Fallersleben (“City of Strength Through Joy at Fallersleben”) as a planned town built to house workers for a factory producing the Volkswagen Beetle car. Volkswagen workers organized labor unions through collective agreements ensuring rights of more than 120,000 workers through the Volkswagen Group Global Works Council (GWC).

VW factory, Wolfsburg, Germany” by photographer HasBS, 2011. Creative Commons 4.0. Included with appreciation.

From the days of Charlemagne and into medieval times, as workers began to move into cities, they organized crafts and trades into guilds. The word “guild” comes from the Anglo-Saxon word “gild” and is related to “geld” meaning money. We still have an echo in today’s word for money in German: Das Geld. In medieval times, each guild member paid a set amount of money into a common fund to support worker training (apprentice, journeyworker, mastercraftsperson) and family benefits for the wellbeing of workers’ health and family support in the case of injury or death. Guilds morphed into trade unions when the owners of businesses changed to outside investors who were not craftpersons themselves. Labor rights were born in the city and have continued to find their growth in urban environments.

Medieval cities were effectively run by guilds representing all the crafts and trades of the local and regional economy. Guilds set worker rights, wages, and benefits. Image: “Coats of arms displaying the tools of the trades in a medieval town of the Czech Republic,” Photo by VitVit, 2008. Creative commons 3.0. Included with appreciation,

Workers and Rights. Some credit present day labor rights activist Robert Owen, a manufacturer from Wales, with the concept of the eight-hour workday. In 1817, Welsh advocated 8/8/8/ (eight hours labor, eight hours recreation, eight hours rest). Fifty years later, workers in Chicago demanded the Illinois Legislature to pass a law limiting work to eight hours per day. Although the law passed, a loop hole remained and many factory laborers were still overworked and underpaid.  On May 1, 1867, they went on strike. The movement shut down Chicago, and soon other cities across the United States and Europe joined the strike. That event in 1867 led to what is now known as May Day or International Workers’ Day.

International Workers’ Day, May 1, 2013, Austria. Image by photographer Johannes Zinner, 2013. Creative Commons 2.0. Included with appreciation.

Labor. Peter McGuire, general secretary of the Brotherhood of Carpenters and Joiners first voiced in 1882 the call for a holiday for “the laboring classes who from rude nature have delved and carved all the grandeur we behold.” McGuire’s message echoed that of the medieval guilds: labor and work are forms of art and should be treasured and honored by a holiday. A leader of a similar surname, Matthew Maguire, secretary of Local 344 of the International Machinists, proposed the same holiday. Their messages were heard.

First American Labor Day parade in New York City on 5 September 1882. Image: Frank Leslie’s Illustrated Newspaper issue dated 16 September 1882. Public Domain. Included with appreciation.

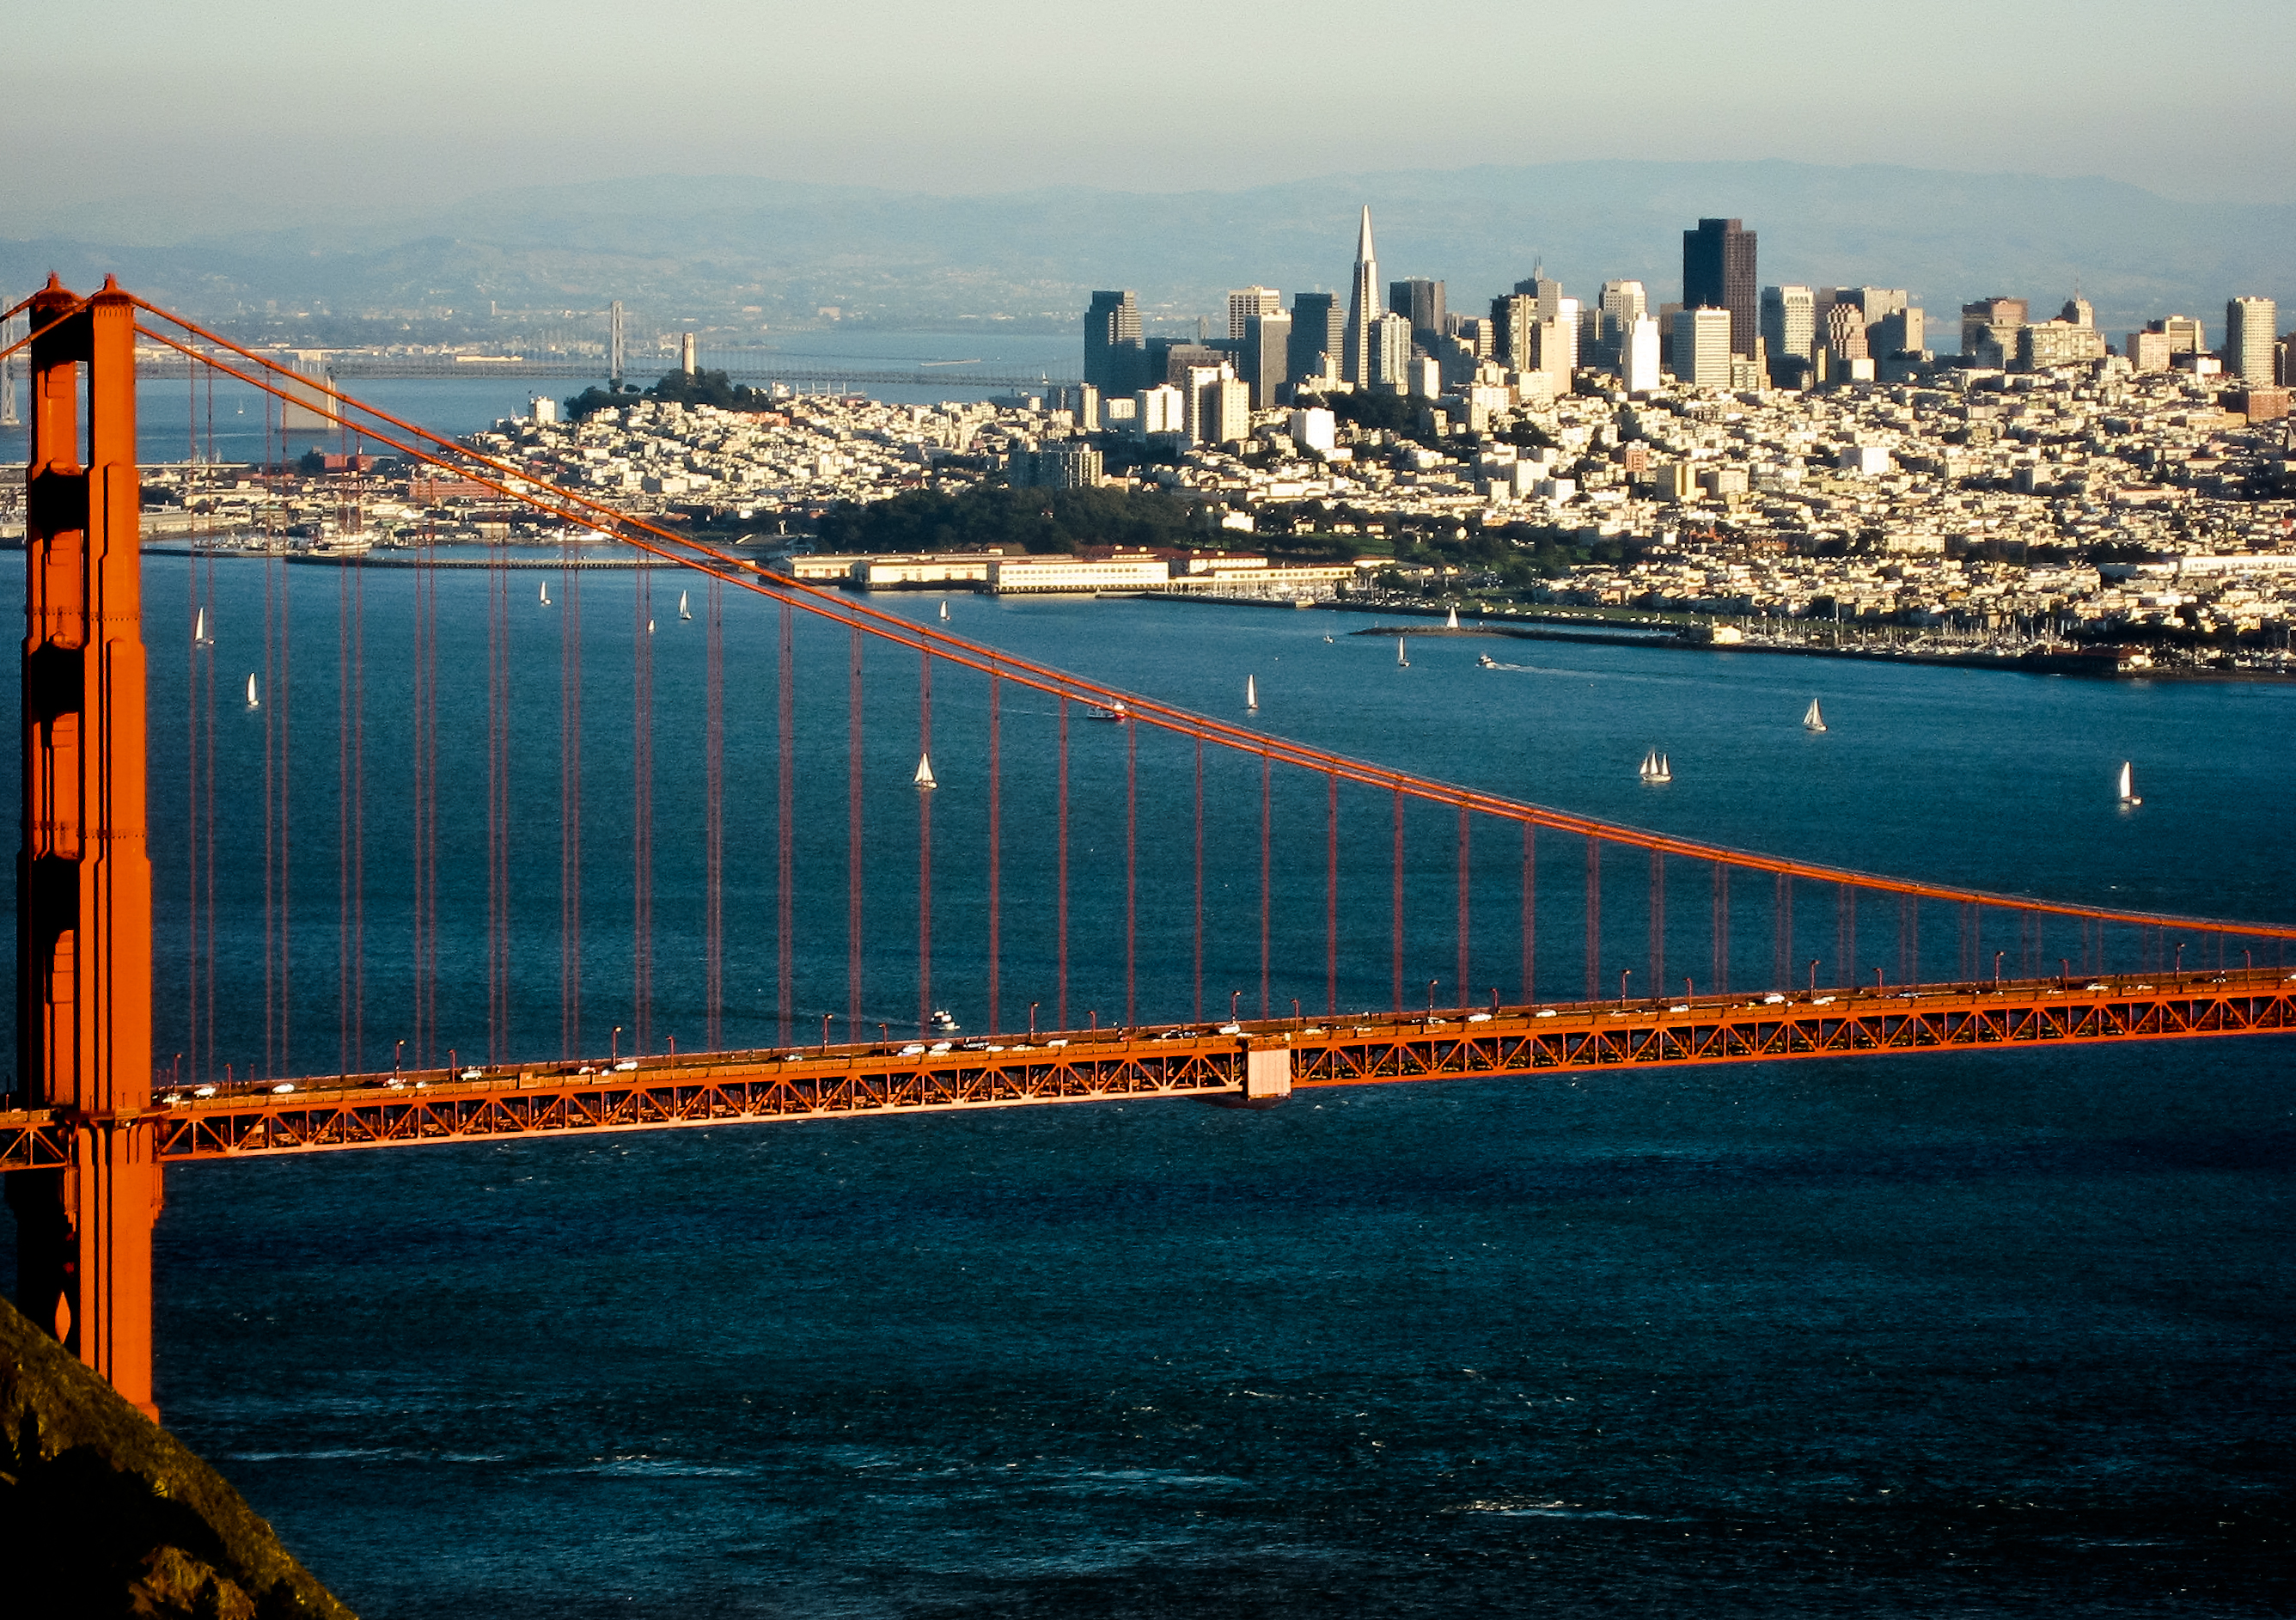
In the shadow of the Brooklyn Bridge, 10,000 city workers gathered in New York City on 5 September 1882 to rally for improvement in labor conditions. When the American government even began tracking work hours in 1890, the average factory workers clocked in 100 hours per week. Ensuing years strengthened the movement for better working hours and recognition of the major role workers play in business and economics. Oregon was the first state to recognize Labor day but Colorado, Massachusetts, New Jersey, and New York soon joined. In 1894, the Pullman strike in Chicago, Illinois jammed rail traffic throughout the country. During the strike and crisis, President Grover Cleveland signed Labor Day into law, as Congress passed an act declaring a national holiday to honor labor on the first Monday in September. Finally, in 1894, Labor Day became an official national holiday. Canada also celebrates Labor Day, but most of the world honors workers on May 1.

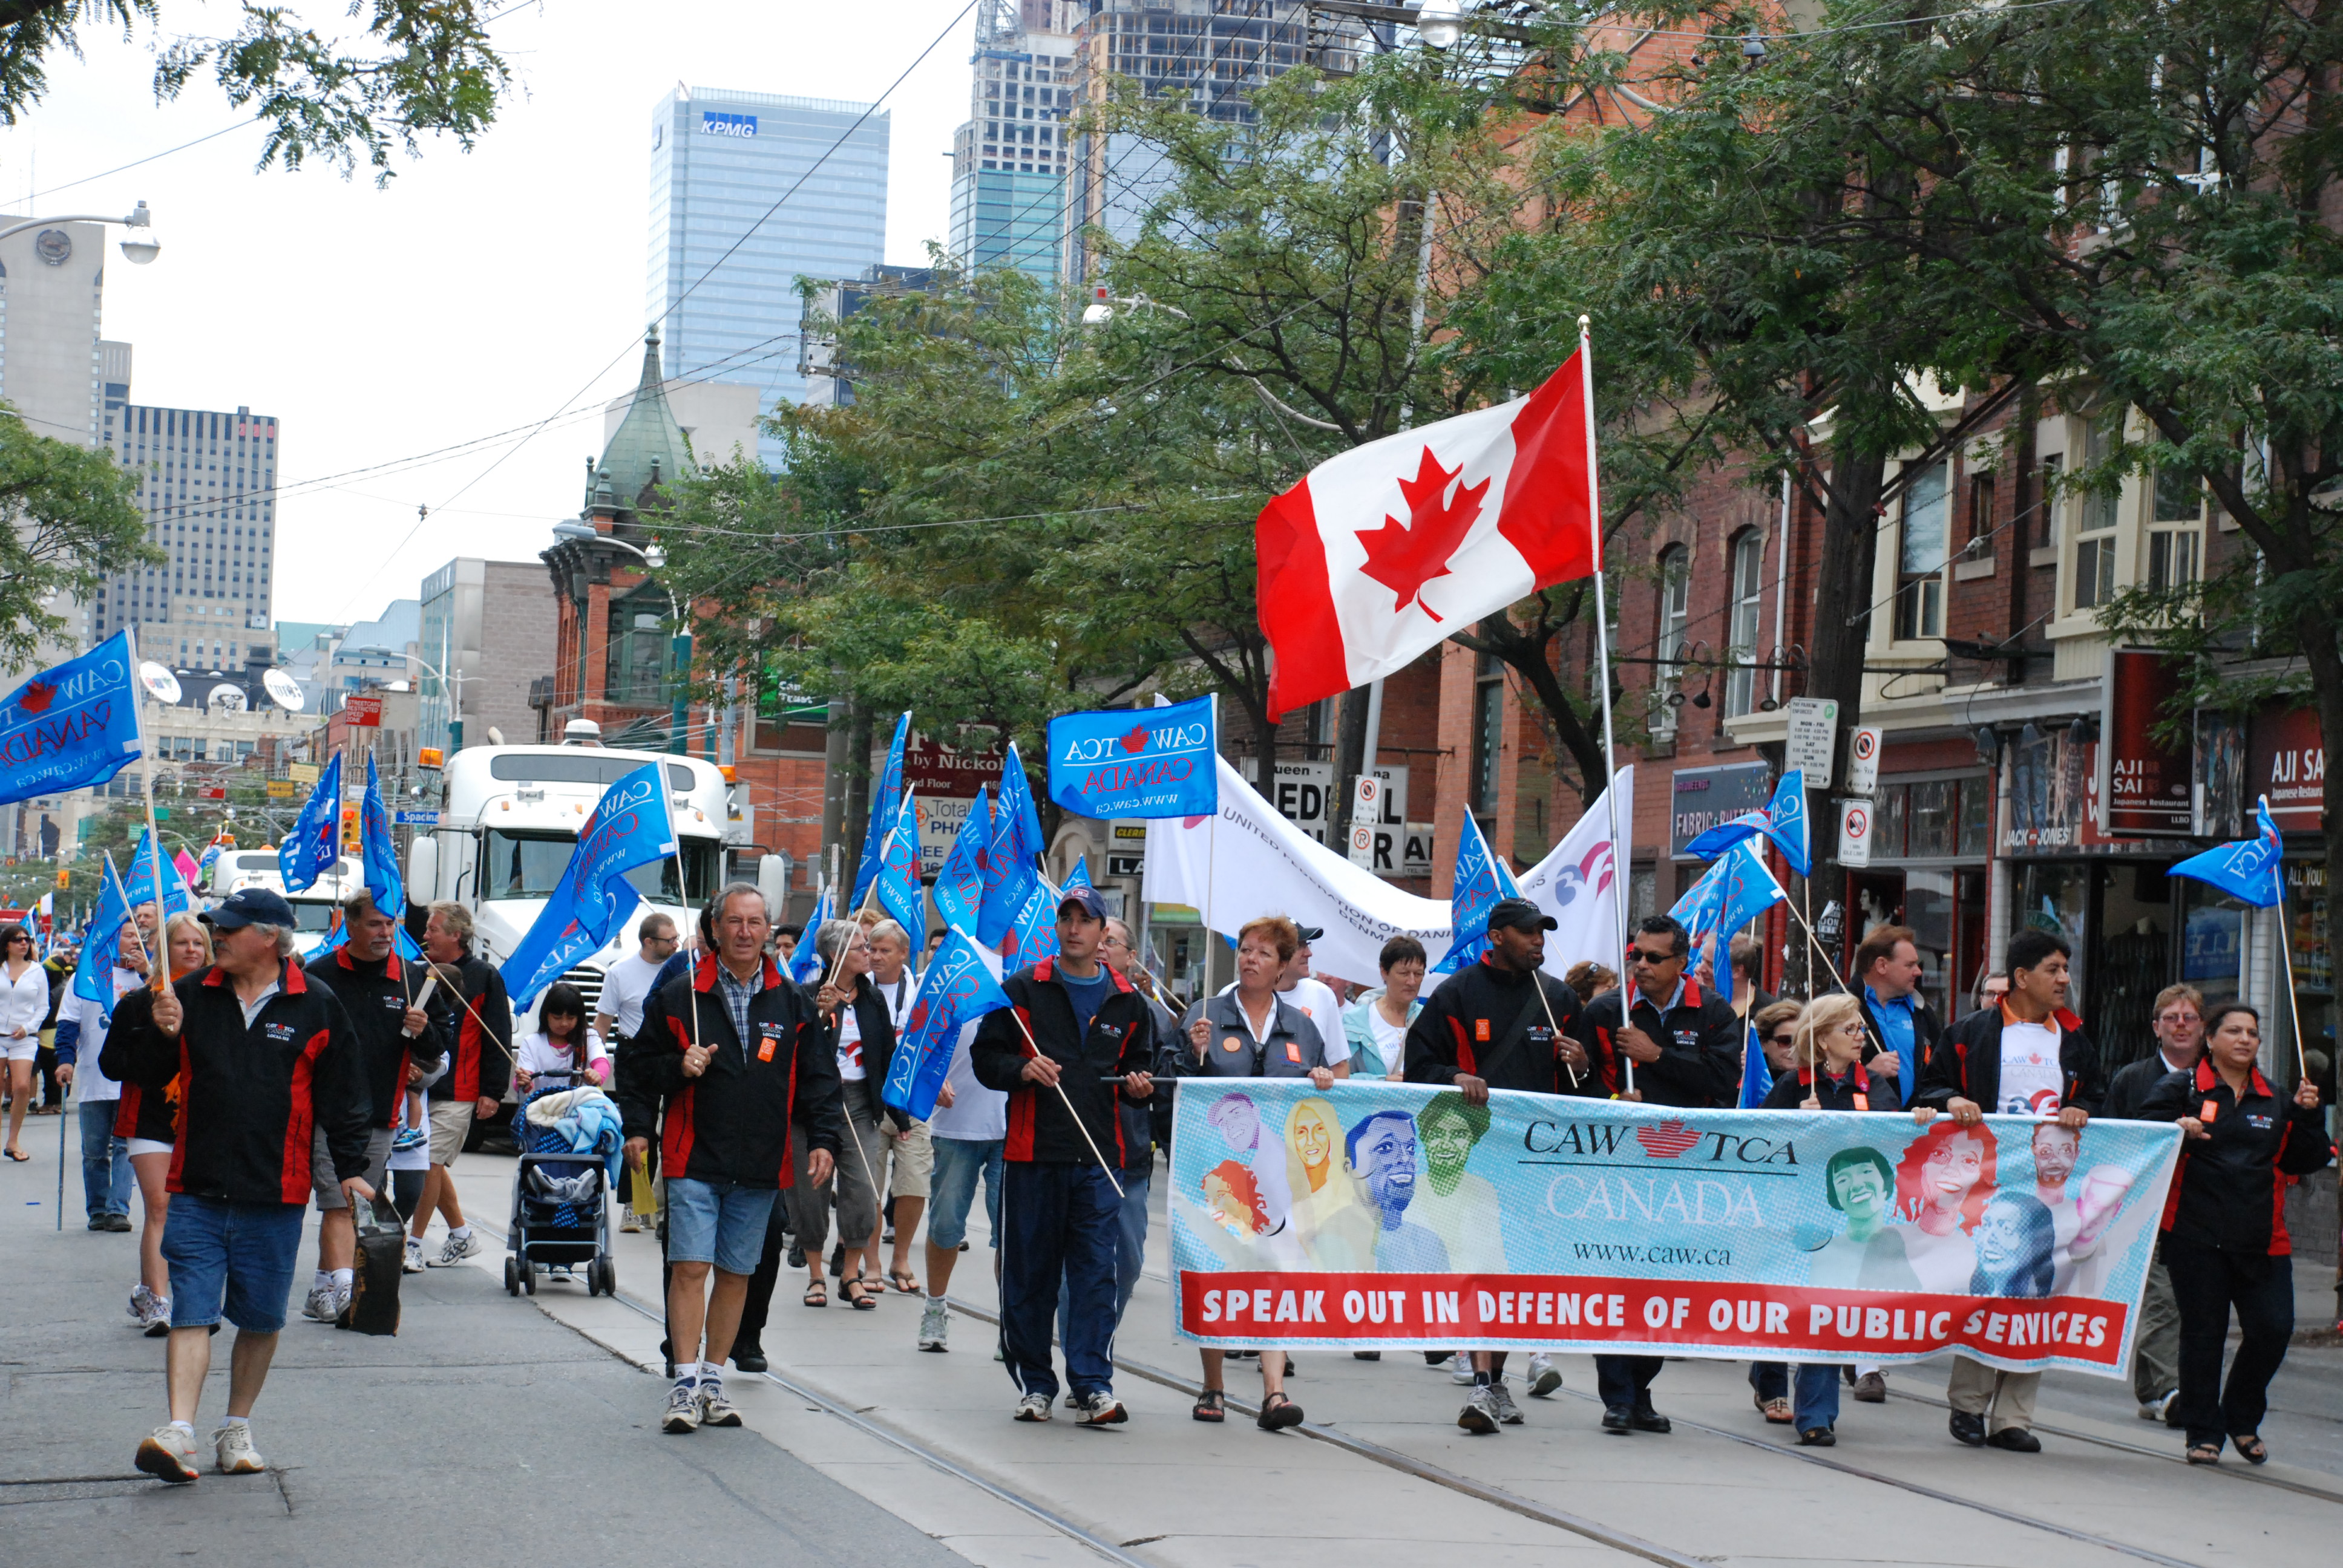
“Fête du Travail” or “Labour Day” Parade in Toronto, Canada. on 5 September 2011. CAW Media. Creative Commons 2.0. Included with appreciation.

Worker rights continue to be an important issue around the world. In some places, children labor. In other places, women cannot work outside the home. Factory workers are often subject to unhealthy and even lethal conditions: 1500 workers died in preventable factory disasters in the garment industry in fires one decade ago. The 2013 Accord on Fire and Building Safety in Bangladesh made progress in setting new standards; a 2018 Transition Key Accord strengthened the standards to legally binding agreements between trade unions and brands; signatories include an oversight chair from the International Labour Organization (ILO)

“Garment Factory Worker in Bangladesh, 2015.” by Solidarity Center. Creative Commons 2.0. Included with appreciation.

Women’s working rights are a special issue. Women make up 70% of the labor force in some export processing zones (EPZs) in Asia, the Americas, and Sub-Saharan Africa where some bans on unionization still exist. The ILO Equal Remuneration Convention (No. 100), Discrimination in Respect of Employment and Occupation (No. 111), and Maternity Protection Convention (No. 183) have helped protect some rights but more is needed. In 1969, the International Labour Organization (ILO) received the Nobel Peace Prize; fifty years later, the ILO issued a new vision when convening the Global Commission on the Future of Work.

Every era brings new challenges for labor, work, and rights. In 2023, the union of Screen Actors Guild and American Federation of Television and Radio Artists (SAG-AFTRA) declared a strike approved by 98% of the members.  One concern of the striking union members is the implications of artificial intelligence (AI) and the expansion of streaming  services.These artists joined the 11,000 members of the Writers Guild of America who are also on strike. Again, the theme of the guild – and its blend of artistry and rights – finds a place in history.

Meryl Streep is one of the active supporters of the SAG-AFTRA strike. Image: “Meryl Street at Berlin Berlinale International Film Festival 2016.” by photographer Glyn Lowe Creative Commons 2.0. Included with appreciation.

If you are reading this post in Canada or in the United States, you may be enjoying a day of rest or even a traditional cook-out. But there is more to Labor Day than a long weekend. How will you celebrate and honor worker equality, justice, rights, and the fruits of our individual, and collective, labors?

Bangladesh Accord Foundation. “Accord on Fire and Building Safety,” https://bangladeshaccord.org/

. International Labor Rights Forum. “Women’s Rights and Global Labor Justice.” https://laborrights.org/issues/women’s-rights

International Trade Union Confederation (ITUC)

International Labour Organization (ILO). “Global Commission on the Future of Work,” https://www.ilo.org/global/topics/future-of-work/WCMS_569528/lang–en/index.htm

Kaunonen, Gary and Aaron Goings. Community in Conflict. Michigan State Press, 2013.

Langley, Winston E. and Vivian C. Fox. Women’s Rights in the United States: A Documentary History. Praeger, 1994. ISBN: 978-0313287558.

Loomis, Erik. A History of America in Ten Strikes. The New Press, 2018.

Smith, Toulmin, Editor, with essay on history and development of the gilds by Lujo Brentano. “English Gilds: The Original Ordinances of more than One Hundred Early English Guilds,” Oxford University Press. Digital facsimile by University of Michigan. https://quod.lib.umich.edu/c/cme/EGilds?rgn=main;view=fulltext

SAG-AFTRA. https://www.sagaftra.org

Seabrook, Jeremy, “The language of labouring reveals its tortured roots.” The Guardian. https://www.theguardian.com/commentisfree/2013/jan/14/language-labouring-reveals-tortured-roots1

Terkel, Studs. Working.  Pantheon Books, 1974.

Toynbee, Arnold. Editor. Cities of Destiny. London: Thames & Hudson, 1967.

Zraick, Karen. “What is Labor Day? A History of the Workers’ Holiday.” 4 September 2023. The New York Times. https://www.nytimes.com/article/what-is-labor-day.html


Print Friendly, PDF & Email

CITIES: HEAT – Below

As above, so (much more) below! Cities can be 18F/10C hotter (0r as high as 20C) below, creating underground climate change. Image: “Morning sunrise above Suwon Gwanggyo Lake with City in Background” by photographer Matthew Schwartz, 2016. Creative Commons 3.0. Included with appreciation.

As above, so below,” goes the saying. Just one look at a large city’s skyscrapers and buildings will hint at the massive infrastructure below. But did you know that climate change, experienced by the occupants of those buildings, is also lurking beneath their urban landscape? Our cities are suffering under heat domes, but it is even hotter below.

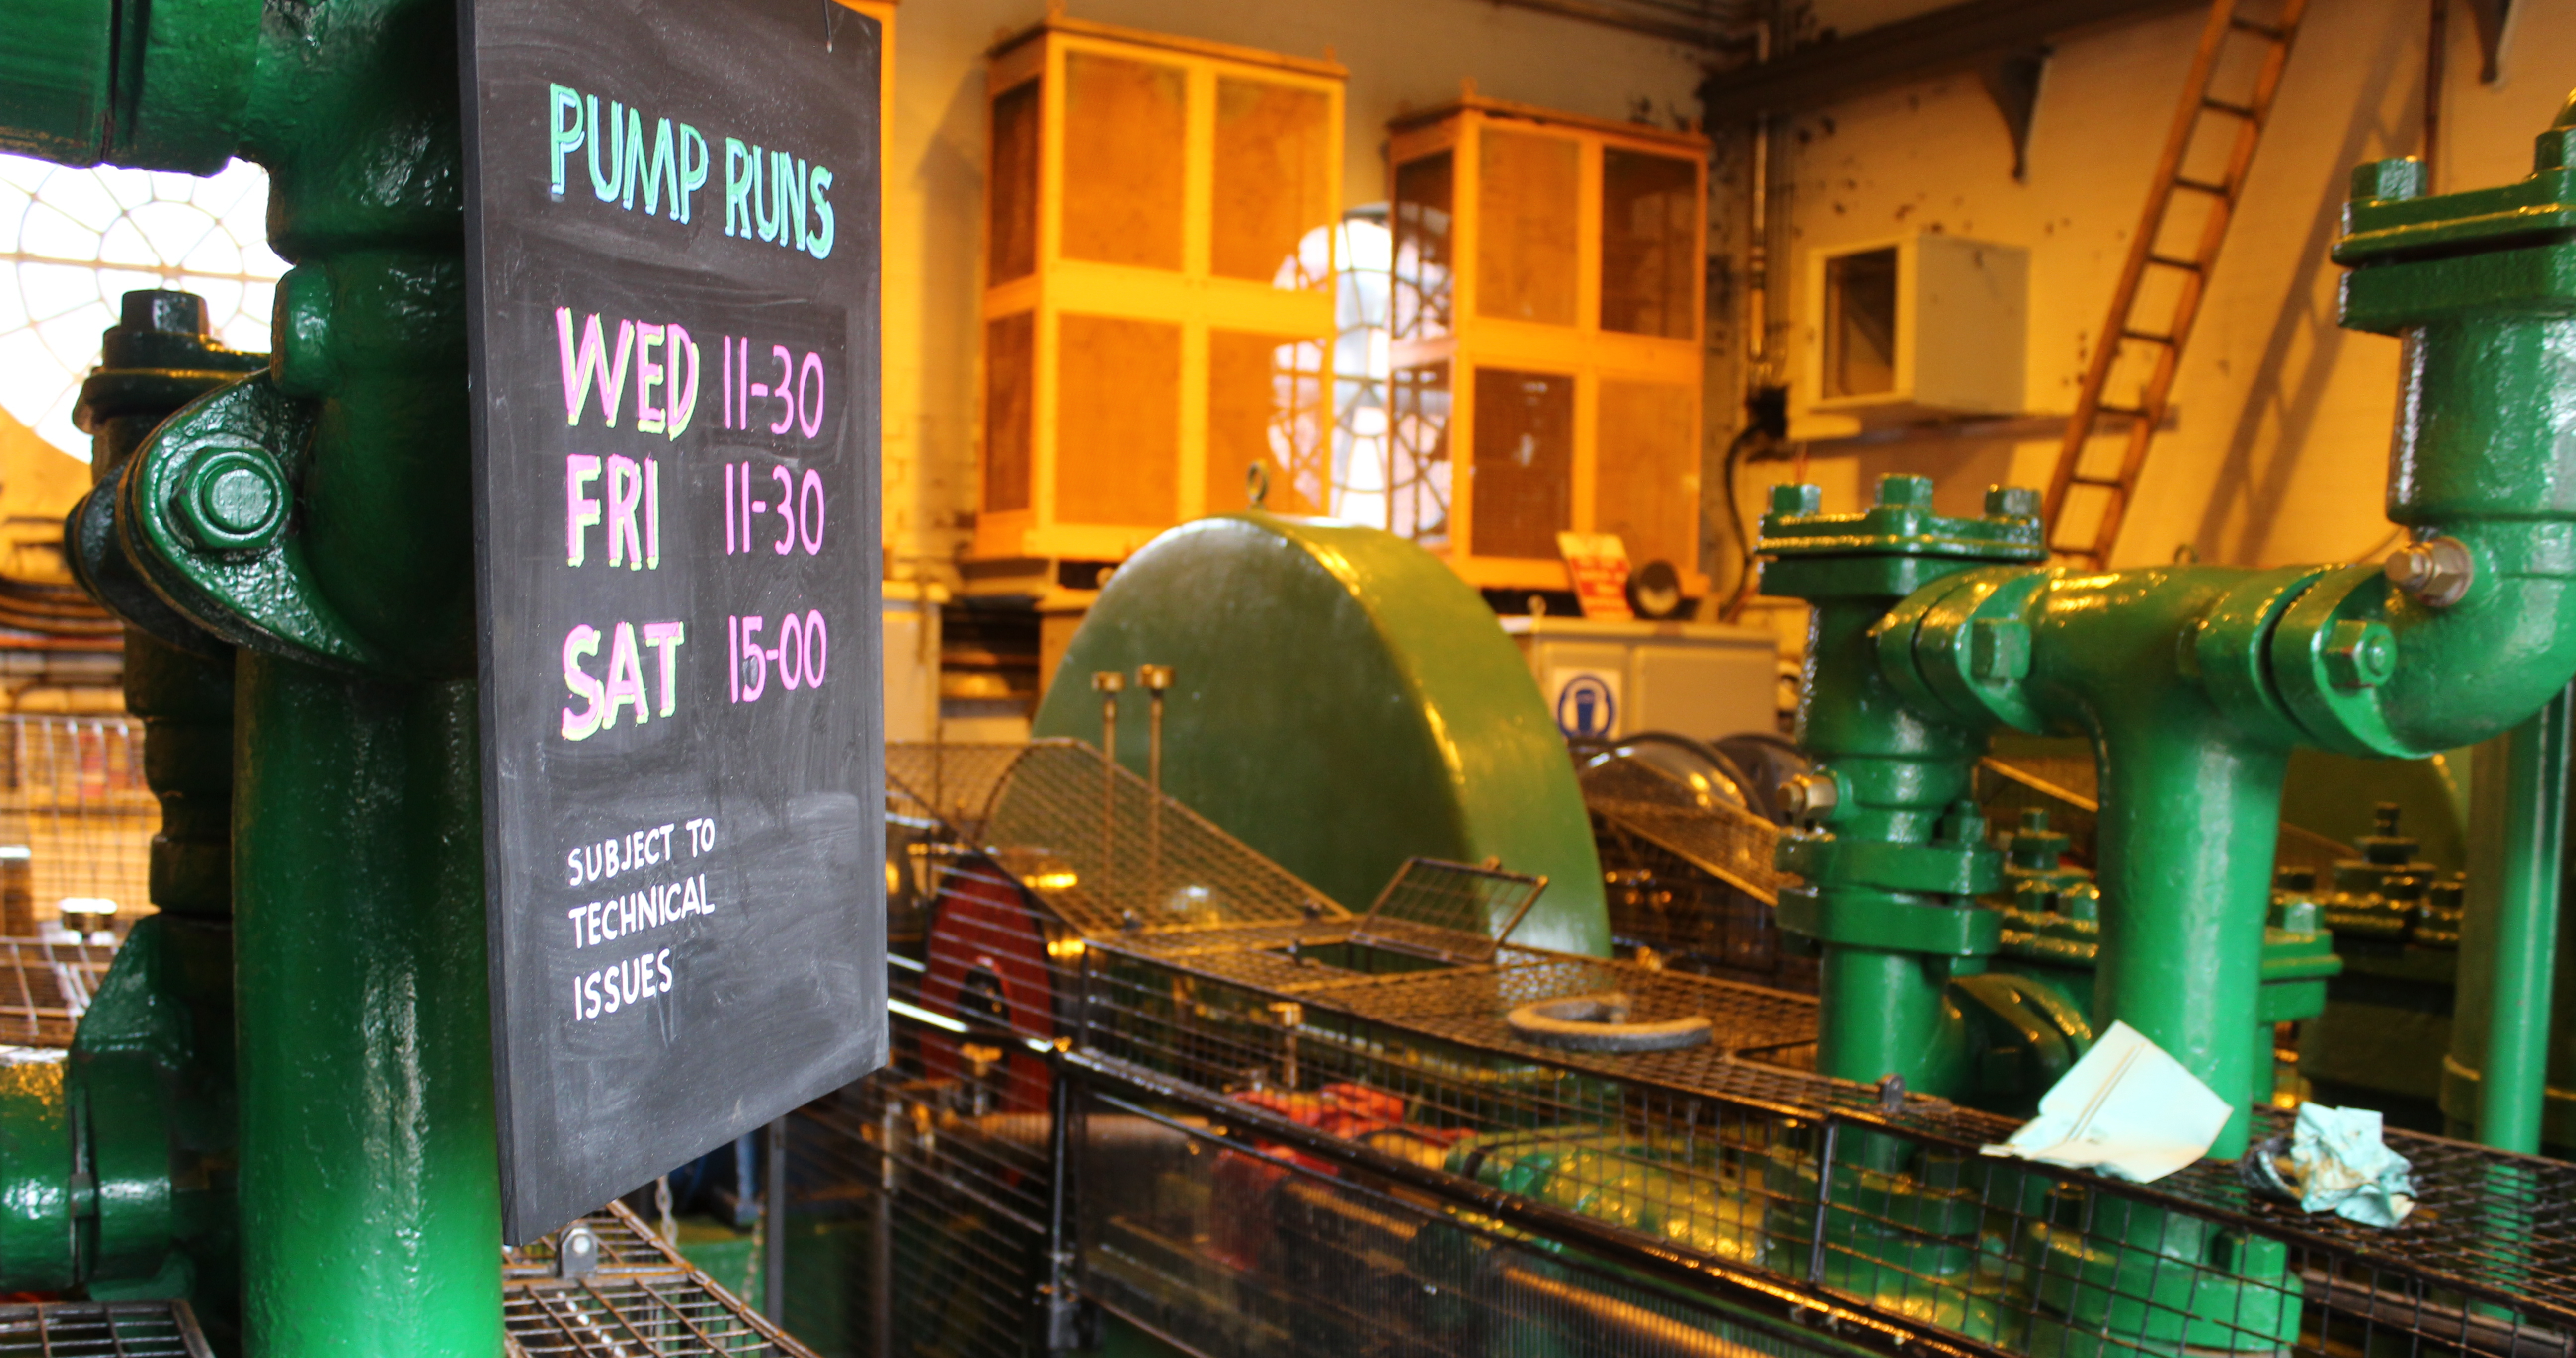
Machinery under buildings is related to “underground climate change,” a growing urban concern. Image: “Underfall Yard Pumps” by photographer Blythe Varney, 2017. Creative Commons 4.0. Included with appreciation.

Problem: The technical term is subsurface heat islands, but it’s easier to think of it as underground climate change. Equipment below skyscrapers generates heat; subways and tunnels create conditions that increase warmth. Pipelines under the ground, even sewers, are sources of subsurface heat. Land around and below large structures changes when heated, triggering slight shifts in topography. Foundations begin to erode; tunnels weaken; train rails warp; retaining walls may show cracks, then collapse.

Subway systems under major cities are one source of underground climate change. Image: “Washington, DC – Farragut West Station, 2018” by photographer Tdorante10. Creative Commons 4.0. Included with appreciation.

Example: A study by Professor Alessandro F. Rotta Loria of Northwestern University placed sensors under buildings and transport infrastructure in Chicago, Illinois, noting that the ground below was measurably hotter than surface land (a difference of 18F/10C). Professor Rotta Loria studies subsurface urban heat islands, warning that “underground climate change can represent a silent hazard for civil infrastructure…but also an opportunity to reutilize or minimize waste heat in the ground.” (Rotta Loria, 2023).

Underground climate change can weaken retaining walls. Image: “Wallstones Breaking” drawing by Dimitry Borshch, 2008. Creative commons 3.0. Included with appreciation.

Difficulty: Because it is out of sight, underground climate change is difficult to recognize – until a retaining wall breaks. Think of it as similar to the gradual change in an iceberg below the water: slow, relentless, and then tragic. Or a slow earthquake: not sudden – until it is.

Chicago’s buildings are hotter underground by as much as 18F/10C. Image: “Chicago Skyline” by photographer Jesse Collins. Creative Commons 3.0. Included with appreciation.

Scale Counts: The bigger the city, the more likely underground climate change is happening. The study cited above was conducted in Chicago: population 2.6 million (2022). The study performed simulations over 100 years: from 1951 when subway tunnels were built under Chicago’s downtown “Loop” to projections until 2051. It is not unique to Chicago. Some of the world’s megacities, with populations over 10 million, could suffer significant damage. Megacities are dense, encouraging high rise construction that may exacerbate underground climate change. Cities that are growing quickly may be particularly vulnerable. For example, the most populous city of Nigeria, and its former capital before the new capital of Abuja was built in 1991, Lagos is among the world’s top ten fastest-growing cities. Another city vulnerable to underground climate change? Tokyo, Japan: population 37 million.

Dense, populous megacities may be the most vulnerable to underground climate change. Image: “Oloosa Market in Lagos, Nigeria,” by Omoeko Media, 2018. Creative Commons 4.0. Included with appreciation.

Emerging Answers: There are two approaches – prevent waste heat underground, or use it. In the area of prevention: new urban building codes, especially for dense cities, will need to place more emphasis insulation and energy efficient design. But secondly, waste heat could be used as an energy resource. Geothermal innovations that capture waste heat from the subsurface can find a use for that energy. Innovations for use of waste energy will become an area of significant potential.

“Climate Change Icon” by Tommaso.sansone91. Created in 2019 and dedicated by the designer to the public domain. Included with appreciation.

Above/Below: We tend to focus on mitigating climate change by addressing what we can see and feel. Noticeable effects are mainly above the ground. But there will also be great need – and opportunity for innovation – below. Is your city likely to experience underground climate change? What are some of the ways your city can measure, assess, plan to address, and even harness for beneficial use, underground climate change? 

Brooke, K. Lusk. “CITIES and HEAT – Above,” 27 July 2023. https://blogs.umb.edu/buildingtheworld/2023/07/27/cities-heat-above/

Khan, Sarah S. “Rising underground heat causes unbearable MTA commutes.” 24 July 2023. The Ticker. https://theticker.org/11622/opinions/rising-underground-heat-causes-unbearable-mta-commutes/

Prisco, Jacopo. “Underground climate change is deforming the ground beneath buildings, study finds.” 17 July 2023. CNN https://www.cnn.com/2023/07/17/world/underground-climate-change-deforming-ground-scn

Rotta Loria, Alessandro F. “The silent impact of underground climate change on civil infrastructure.” 11 July 2023. Communications Engineering 2, 44 (2023) https://doi.org/10.1038/s44172-023-00092-1

Zhong, Raymond with photographs by Jamie Kelter Davis. “Rising Heat Underground Is Sinking Chicago Ever So Slightly.” 11 (updated 14) July 2023. The New York Times. https://www.nytimes.com/2023/07/11/climate/chicago-underground-heat.html

Building the World Blog by Kathleen Lusk Brooke and Zoe G. Quinn is licensed under a Creative Commons Attribution-NonCommercial-NoDerivs 3.0 U


Print Friendly, PDF & Email

CITIES: HEAT – Above

The sun is baking Earth, especially cities. Image: “Sun spots on surface of sun” by telescope photographer David Dayag. Creative Commons 4.0. Included with appreciation.

HEAT – So far, July 2023 has been the hottest on Earth in history. Sadly, that breaks the record just set in June 2023. The heat has set new records equally in Canada, United States, Mexico, Europe, Asia, and eastern Australia. If 2022 is any indication, the heat will be deadly: 11,000 people died from heat that year – every week. It was not just heat stroke; high temperatures and humidity are dangerous for people coping with heart and pulmonary conditions. The heat is coming both from the sun and from the very ground on which we stand. In this post, we’ll explore heat coming from above, as it affects cities.

Urban heat island. Image drawn from data of U.S. National Oceanic and Atmospheric Administration (NOAA), 2008, and refined by graphic artist The New Phobia. Image is based on public information and therefore in the public domain, creative commons. Included with appreciation,

Cities are especially prone to heat retention. A study based on satellite land surface temperatures from 2002-2021 revealed cities are 29% hotter than rural locations. In the United States, over 100 million people are presently under a “heat dome.”

How does a “heat dome” form? It’s a phenomenon we may see more often, as the climate warms. Image: “Heat Dome during Heat Wave” from U.S. National Weather Service, 2011. Public Domain. Included with appreciation.

Southern Europe is suffering, and heat is now reaching central states like Germany and Poland. The metal of the Eiffel Tower expands in temperatures over 40C, growing as much as 6 inches (0.152 meter). Paris, France reached 109F (42.7C) this summer, affecting the Tower, as well as those sweltering beneath in the nearby cafes.

The Eiffel Tower’s iron expands in high heat, causing the iconic structure to grow taller. “Tour Eiffel” by photographer Nitot, 2005. Included with appreciation.

Asia is also affected. In April 2023, a heat wave began in Asia that caused 179 deaths and 460 hospitalizations in India. Schools were closed in Odisha; blackouts in power stations affected Lucknow. Singapore had the warmest month of May on record in 2023. China recorded a temperature of 125 degrees Fahrenheit (52.2C) recently.

“Heat Wave Sign” from Guangdong, China. Image: People’s Republic of China, 2005. Image is public domain in China and included with appreciation.

Cities are not only the hottest places on the planet, they are becoming the future. By 2050, 68% of the world’s population will live in cities. In 1960, there were only two mega-cities (with populations over 10 million: New York and Tokyo. In 1990, there were ten; in 2014, 28. By 2040, there will be 40 cities with over 10 million people. In our era of global warming, heat is and will continue to be an urban problem. Where can solutions be found?

Phoenix, Arizona, USA has experienced temperatures at or above 110F (43.3C) during the entire month of July 2023. Image: “Phoenix, Arizona skyline, facing west, 2004” by photographer Bravo1. Dedicated to the public domain by the photographer. Included with appreciation.

SOLUTIONS – Immediate

Create a Heat Risk Map for your city – Durban, South Africa; New York, USA; and Toronto, Canada have already posted heat vulnerable areas online, using Landsat data.

Install sensors to measure surface temperature and humidity – Madrid, Spain has launched a sensor network system.

Develop a Heat Action Plan for your city, working with local communities and councils. Ahmedabad, India saved over 1,000 lives since the city launched its Heat Action Plan in 2013, the first South Asian city to do so. A new version is updated yearly.

Open Cooling Centers and a finder map via an app: Washington DC, USA,; Paris, France; Athens, Greece, and Rotterdam, Netherlands have created apps that indicate the closest cooling center.

Athens, Greece, has opened cooling centers. In July 2023, wildfires caused evacuations on the Greek island of Rhodes in heat reaching 113F/45C. Image: “Athens at Sunset” by photographer Panos Zoulakis, 2019. Creative Commons 4.0. Included with appreciation.

SOLUTIONS – Longer Term

Plant trees, bushes, heat-absorbing vegetation to relieve urban heat.

Encourage green roofs and green walls in which a layer of vegetation grows upon a building’s surface to absorb sun and heat.

Upgrade building codes to specify cooling materials for construction, especially roofs.

Paint roofs with white paint, including one developed by Professor Xiulin Ruan and team from Purdue University that reflects sun and heat away from buildings, reducing heat by 98%.

Repave city streets and sidewalks – these surfaces cover 40% of a city’s land. Innovations in pavements include higher permeability to cool surfaces by evaporation.

Support research and development for new kinds of fans and air-conditioning. As the world warms, demand for air-conditioning will increase, especially in dense cities.

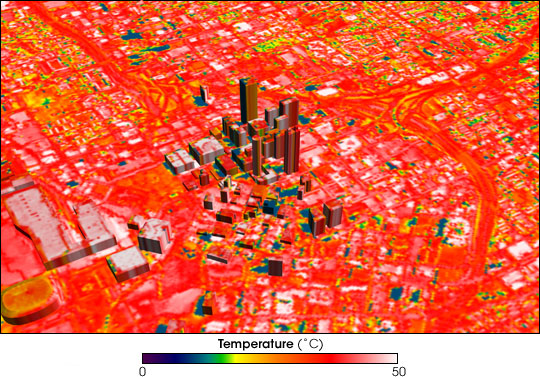
Thermal map of Atlanta, Georgia, USA based on NASA satellite data, May 11-12, 2009. Blue=cooler; red=warm; white=hot. Public Domain. Included with appreciation.

Summary: we are only now beginning to experience the heat of global warming. Large cities will become dangerous due to urban density, construction, and paved surfaces. But cities are also most able to respond quickly and to test innovations. What are conditions in your area? What are your ideas for responding to urban heat? 

Brooke, K . Lusk. “Mega-Cities from 1960 to 2020 – growth and predictions.” Pages 110-120, Five Foundations for Building a Better World, 2018.

C40. “How to Adapt your City to Extreme Heat.” https://www.c40knowledgehub.org/s/article/How-to-adapt-your-city-to-extreme-heat?language=en_US

Cappucci, Matthew, with contributions by Jason Samenow,  “Coast-to-coast heat home sends temperatures soaring, threatens all-time records.” 13 July 2023. The Washington Post.

Gallego, Mayor Kate. “Phoenix mayor on how the city is coping with heat above 110 degrees every day of July.” 25 July 2023. All Things Considered. National Public Radio interview with Juana Summers. AUDIO: https://www.npr.org/2023/07/25/1190062458/phoenix-mayor-on-how-the-city-is-coping-with-heat-above-110-degrees-every-day-of

Li, Xiangyu, et al., “Full Daytime Sub-ambient Radiative Cooling in Commercial-like Paints with High Figure of Merit.” 21 October 2020. Cell Reports Physical Science, Volume 1, Issue 10. https://doi.org/10.1016/j.xcrp.2020.100221

Liu, Zihan, et al., “Surface warming in global cities is substantially more rapid than in rural background areas.” 29 September 2022, Communications Earth & Environment 3, 219 (2022). https://doi.org/10.1038/s43247-022-00539-x

Madrid, Spain. “Sistema de Vigilancia de la Calidad del Aire del Ayuntamiento de Madrid.” https://www.mambiente.madrid.es

Purdue University. “The whitest paint is here – and it’s the coolest. Literally.” 15 April 2021. Purdue University News. https://www.purdue.edu/newsroom/releases/2021/Q2/the-whitest-paint-is-here-and-its-the-coolest-literally.html

Sherriff, Lucy, “The simple ways cities can adapt to heatwaves: Satellite images reveal how green spaces, white roads, and water features are helping keep cities cool during deadly heatwaves.” 6 July 2023. BBC Future Planet. https://www.bbc.com/future/article/20230706-the-simple-ways-cities-can-adapt-to-heatwaves

Great appreciation to Rachael M. Rusting for sharing research.

Building the World Blog by Kathleen Lusk Brooke and Zoe G. Quinn is licensed under a Creative Commons Attribution-NonCommercial-NoDerivs 3.0 U


Print Friendly, PDF & Email

CITIES: Cliffhangers

Waves and sea level rise will affect low-lying cities, but what about coastal cliffs? Image: “Porto” by photographer/videographer Sergei Gussev, 2016. Creative Commons 2.0. Included with appreciation.

It’s obvious that sea level rise will threaten low-lying coastal areas. But more than 50% of all Earth’s coasts are cliff-lined. Are these higher elevations safe? Not really.

Climate scientists and city planners worrying about sea level rise have mostly focused on immediately vulnerable low-lying cities. That’s appropriate and urgent: more than one billion people may be displaced. It is also important to note that many of the world’s most important cities began as ports, at a time when shipping was the main means of global commerce. What will happen to powerful port cities like Amsterdam, Boston, Lagos, Rio de Janeiro, or Singapore – great port cities that continue to attract businesses and residents? Lagos leads Africa in the number of innovation start-ups. But building more offices and apartments stresses already-dense ports, making these cities more vulnerable to sea level rise and coastal flooding.

But rocky, cliff-lined coasts have been neglected. Because cliffs make up more than 50% of the world’s coasts, their erosion is also of importance. It’s just been harder to see. Until now.

New techniques using geochronology and cosmogenic radionuclide dating can tells us what has happened to world cliffs 8,000 years ago – and predict what may occur in the future. It’s a technology as useful in space as on Earth. Image: “Geochronology/cosmogenic radionuclide dating” by COMPTEL, 2012. Public Domain. Included with appreciation.

Recent studies show that sea level rise will likely accelerate rock coast cliff retreat rates. A team including Bethany Hebditch, Matthew Piggott, Dylan Rood, Alexander Seal, and Jennifer Shadrick, from the Department of Earth Sciences and Engineering, Imperial College, London, UK, as well as Klaus Wilcken of the Centre for Accelerator Science, Australian Nuclear Science and Technology Organization (ANSTO), Sydney, Australia, and Martin Hurst of the School of Geographical and Earth Sciences, University of Glasgow, UK developed a coastal evolution model based on cosmogenic radionuclide (CRN) and topographic data that quantified cliff retreat rates. With a Janus-like long view, the model gazes back 8,000 years and uses that data to forecast the next 100 (and beyond).

“Cliffed coast” by graphic artist Salino. Dedicated to the public domain and included with appreciation.

Models can be helpful.  Developed by Alan Trenhaile, Department of Earth Sciences, University of Windsor, Windsor, Ontario, Canada, one model looks at cliff retreat and broken waves attacking the coastal cliff, resulting in erosion. Another model by a team including Lorenzo Mentashi and Luc Feyen and Jean-Francois Pekel of the European Commission, Joint Research Centre (JRC), Directorate for Space Security and Migration, in Ispra, Italy, as well as  Michalis Vousdoukas, of the JRC and the Department of Marine Sciences, University of the Agaean, Mitilene, Lesbos, Greece, and Evangelos Voukouvalas of the Engineering Ingegneria Informatica, Rome, Italy is the Soft Cliff And Platform Erosion (SCAPE) that predicts erosion of soft cliffs. Other models like 1-D examine wave force, but they are based on historical observations and we all know that things are changing.  Actually, no one thing causes cliffs to erode and retreat: it’s a combination of tides, currents, waves, air and water temperatures.

Bideford, England may be changed by sea level rise and cliff retreat. Image: “Tantons Hotel in Bedeford” by photographer Steve Daniels, 2009. Creative Commons 2.0. Included with appreciation.

The UK/Australia study team focused on two sites in the United Kingdom (UK): Bideford in north Devon and Scalby in Yorkshire. Here’s what they found. At both sites, cliff retreat matched late-Holocene sea level rise. They also noted that cliff retreat is more sensitive to the rate of sea level rise increase than to its magnitude. Conclusion? Cliff erosion is “dominated” by waves; cliff retreat is linked to the rate of sea level rise. As climate change drives sea level rise, “cliff positions are likely to retreat by at least (10-14 meters) at Bideford and (13-22 meter) at Scalby. These rates of cliff retreat are two times greater than any previous estimates and as an order of magnitude greater when compared with the past half millennium.

Will cliff erosion threaten California’s Big Sur and the Pacific Coast Highway? Image” Big Sur and the Pacific Coast Highway” by photographer Astronautilus, 1995. Creative Commons 2.0. Included with appreciation.

We once thought of rock cliff coasts as unchangingly stable. They are just slower. From the White Cliffs of Dover, England, made of finely grained, chalky limestone, to the coastline of the Santa Lucia Mountains in Big Sur, California, iconic cliff coasts may be changed through sea level rise. Some locations, like Puerto Escondito, Oaxaca, Mexico have both low-lying beaches like surfing favorite Playa Zicatela not far from cliff-lined beaches like Playa Carrizalillo. Protective measures for seaside cliffs include anchoring (by means of terraces, planting, or even wiring) or dewatering (draining water flowing into nooks and crannies), or engineered smoothing at the base reinforced by granular material. Most coastal cliff erosion happens at the bottom where waves attack and weaken the structure.

How can we protect coastal cliffs? What are your ideas? Image: “Ocean shaped coastline and silhouette person” by photographer MontyLov, 2017. Dedicated to the public domain, creative commons 1.0. Included with appreciation.

The next time you enjoy a panoramic ocean view from atop a promontory, consider your ideas for shoring up coastal cliffs.

City of Boston. “Climate Ready Boston Executive Summary.” https://www.boston.gov/sites/default/files/file/2023/03/2016_climate_ready_boston_executive_summary_1.pdf

SCAPE. “Resilient Boston Harbor Vision – SCAPE” https://www.scapestudio.com/projects/resilient-boston-harbor-vision/

Shadrick, Jennifer R., et al., “Sea-level rise will likely accelerate rock coast cliff retreat rates” 18 November 2022. Nature Communications 13, 7005 (2022). https://doi.org/10.1038/s41467-022-34386-3

Sivaprasad, Dave. “Mangroves, Storm Walls and Other Ways to Protect Coasts from Climate Change.” 26 April 2023. Boston Consulting Group (BCG). VIDEO. https://www.bcg.com/videos/protecting-coastal-communities-impacted-by-climate-change

Trenhaile, Alan.S. “Modeling the development of wave-cut shore platforms.” 15 May 2000. Marine Geology 166,163-178.

Trenhaile, Alan.S. “Predicting the response of hard and soft rock coasts to changes in sea level and wave height.” 22 February 2011. Climactic Change 109-599-615. http://doi.org/10.1007/s10584-011-0035-7 and https://link.springer.com/article/10.1007/s10584-011-0035-7

Young, A. and Carilli, J. “Global distribution of coastal cliffs and retreat rates.” EP23C-EP22336(2018)

Young, A. and Carilli, J. “Global distribution of coastal cliffs. Earth Surf Process Landforms 44:1309-1316. https://doi.org/10.1002/esp4574

Note: we have named all the team members, above in the post, to value each one’s contribution that is seldom recognized when listed as “et al.”

Building the World Blog by Kathleen Lusk Brooke and Zoe G. Quinn is licensed under a Creative Commons Attribution-NonCommercial-NoDerivs 3.0 U


Print Friendly, PDF & Email

WATER: Colorado River and the Future

And it’s only gotten worse since: 2023 is a critical year to determine the future of the Colorado River. Image: “Drought: before and after.” Photo, United States National Park Service. Wikimedia creative commons public domain. Included with appreciation.

Sharing water is one of the oldest bonds of community. Ancient villages centered around the well; urban settlements like Rome were built near rivers; great cities and civilizations began as ports.

“Rome: A view of the river Tiber looking south with the Castel Sant’Angelo and Saint Peter’s Basilica beyond” by Rudolf Wiegmann, 1834. Wikimedia, public domain. Included with appreciation.

But when neighboring communities are seven large states, the water is the Colorado River, and drought conditions are straining resources: sharing is proving difficult. Camille Touton, Commissioner of the US Bureau of Reclamation, official manager of the river, recently ordered Arizona, California, Colorado, Nevada, New Mexico, Utah, and Wyoming to cut 1/3rd of their water usage. Encouraging states to figure it out amicably, Touton warned that if no solution were soon agreed, the federal government would settle the score. The matter is urgent: the Colorado River provides water for drinking and irrigation for 40 million people. Moreover, if Colorado River reservoirs Lake Mead and Lake Powell reach ‘dead pool’ the Hoover Dam will not supply electricity.

Colorado River: Upper and Lower Basin States. Image from USGS data by Shannon1. Creative Commons 4.0. Included with appreciation.

The Law of the River, a 100-year compendium of laws regulating the Colorado River from inception of the Compact in 1922 to 2022 (and now continuing), is both history and future. As farmers claimed more water to grow food to feed a nation, and as cities like Los Angeles and Las Vegas burgeoned in population, dueling needs competed for resources. Add drought and the arguments became more heated.

Las Vegas gets drinking water and electricity from the Colorado River. Image: “Las Vegas by Night, 2019” by Notdjey. Creative commons 2.0. Included with appreciation.

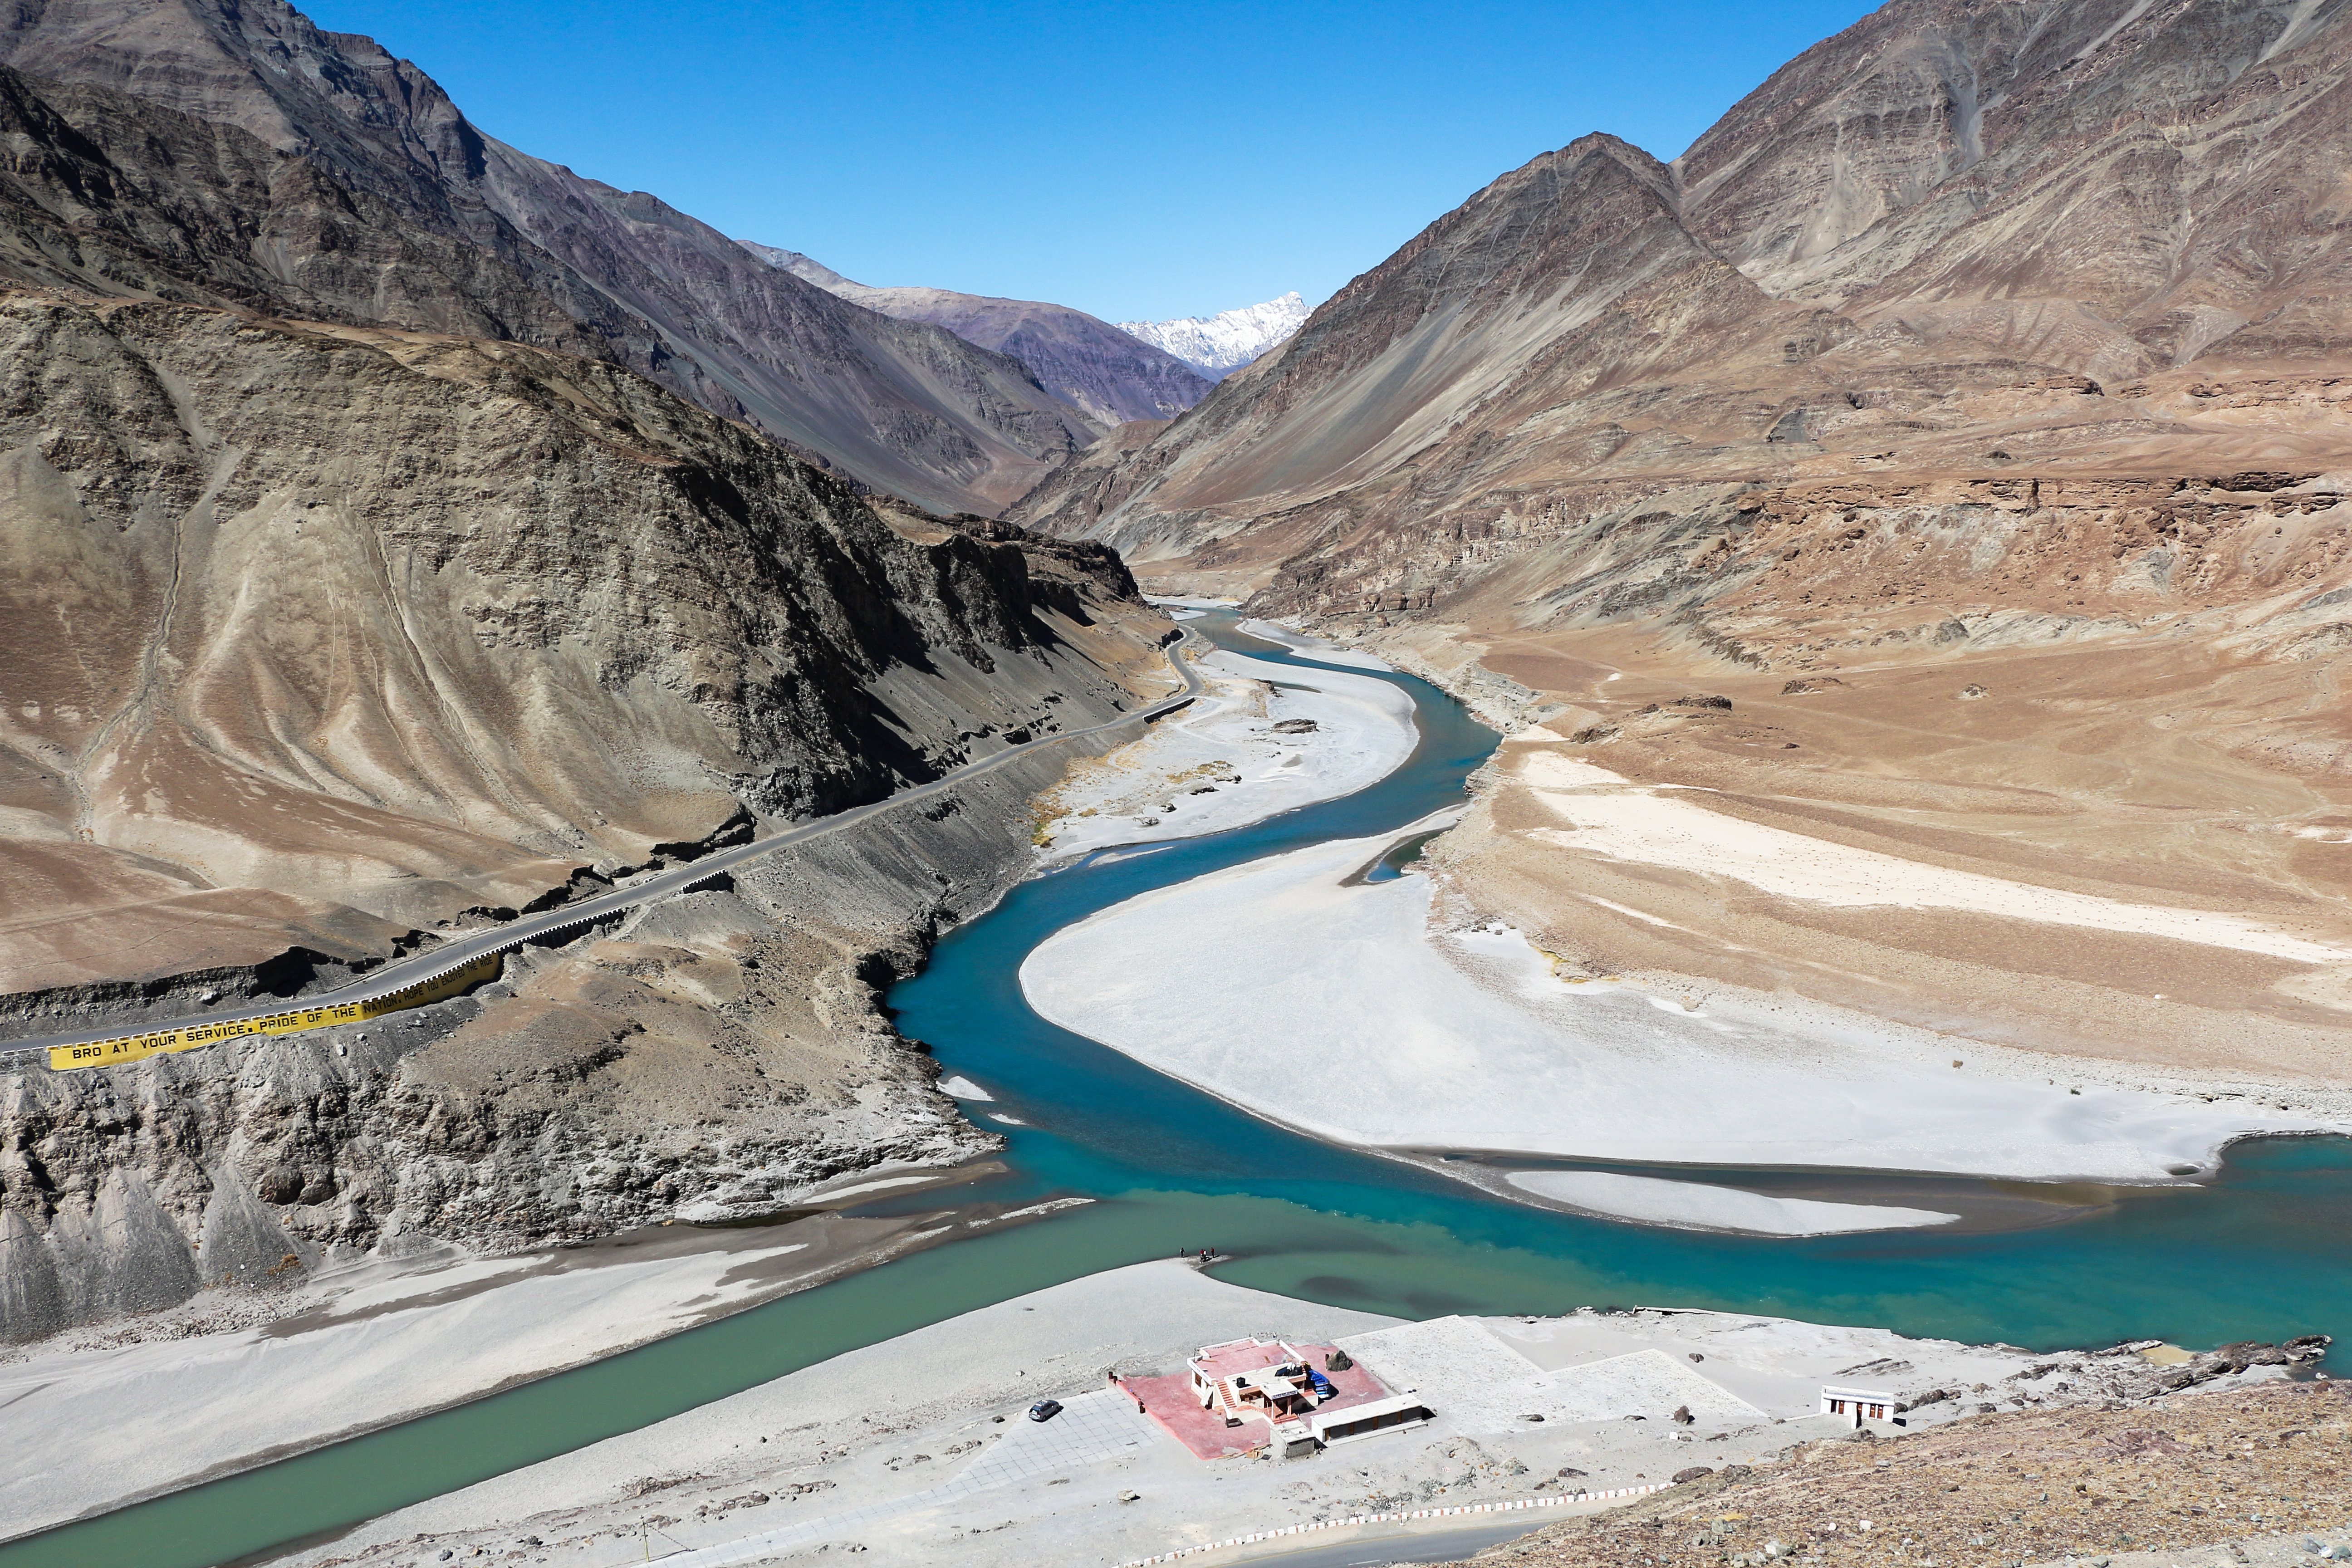
The Colorado River will affect water policy in the United States, Compact partners of Mexico and the original American Sovereign Nations, but around the world. One third of all the rivers and lakes globally are facing drought. Rivers like the Amazon, Indus, Nile, Po, Rhine, and Yangtze, among others, will debate similar decisions.

“Confluence of Indus and Zanskar Rivers” by Bernard Gagnon, 2018. Creative commons 4.0. Included with appreciation.

Rivers support agriculture, drinking water, fish and marine life, barge traffic, and hydroelectricity. How should stakeholders work together to decide who gets water and why?

Interested in how Colorado River decisions will affect other rivers worldwide? Click here.

Henley, Jon. “Europe’s rivers run dry as scientists warn drought could be worst in 500 years.” 13 August 2022. The Guardian. https://www.theguardian.com/environment/2022/aug/13/europes-rivers-run-dry-as-scientists-warn-drought-could-be-worst-in-500-years

Nilsen, Ella. “California floating cutting major Southwest cities off Colorado River water before touching its agriculture supply, sources say.” 1 February 2023, CNN. https://www.cnn.com/2023/01/31/us/california-water-proposal-colorado-river-climate

United States Bureau of Reclamation. “Colorado River Basin.” https://www.usbr.gov/ColoradoRiverBasin

United States Bureau of Reclamation. “The Law of the River.” https://www.usbr.gov/lc/regiona/g1000/lawofrvr.html

Building the World Blog by Kathleen Lusk Brooke and Zoe G. Quinn is licensed under a Creative Commons Attribution-NonCommercial-NoDerivs 3.0 Un

Print Friendly, PDF & Email

CITIES: Fast Forward Food

“Noodle Bowl for Lunch” by Tran Mau Tri Tam, 2016. Wikimedia/Unsplash: CC0 1.0. Dedicated to the public domain by the photographer. Included with appreciation.

Cities are known for fast food: the drive-through, the grab and go, the snack stop, pop-up restaurants, food trucks, street cafes and food stalls. Fast food can also be found on shelves of urban convenience and grocery stores. One of the world’s favorite quick treats is the instant noodle. In 2020, 116 billion servings of instant noodles were enjoyed. (Cairns 2022)

“Singapore Skyline at Night with Blue Sky.” Merlion444, 2009. Wikimedia Creative Commons 1.0 public domain. Dedicated to the public domain by the photographer, Included here with appreciation.

Singapore, a city created with trade and diversity as founding principles, is home to the launch of new kind of instant noodle  –  good for taste and for the environment, too. Based in Singapore, WhatIF Foods has introduced a noodle made from the Bambara Groundnut.

“Vigna subterranea” as illustrated by A. Engler in Die Pflanzenwelt Ostafrikas und der nachbargebiete. Volume 2, 1895. This work is the public domain and is included with appreciation.

Bambara (Vigna subterranea) is in the legume family and grows underground (like peanuts): it originated in West Africa and is now grown across the world. It’s what is known, nutritionally, as a complete food: offering protein, carbohydrates, amino acids, minerals, vitamins, and fiber. WhatIF Foods produces “BamNut” flour made into noodles. The noodles are a bit pricier than the cheapest brands, but many people may value their superior nutrition.

Map of West Africa by Mondo Magic, 2009. Dedicated by the artist to the public domain (CC 1.0) and included here with appreciation.

Bambara Groundnut, or Vigna subterranea, currently comprises a very small part of food supply market (production in Africa is 0.3 million tons) versus the more traditional noodle dough made from wheat (776.6 million metric tons per year globally). But that may change – because Bambara is drought-tolerant. Many areas of the world already suffering drought (from states served by the Colorado River in the United States, to African and Australian areas experiencing drought and expecting more due to climate change and warming). Crops that can survive in dry soil will be in demand. Recent figures from the United Nations reveal that dry soil chokes 40% of agricultural land, and 56 acres (23 hectares) of arable land are lost to drought EVERY MINUTE.

“Corn shows the effects of drought in Texas,” by USDA’s Bob Nichols, 20 August 2013. This photo is the public domain and included here with appreciation to USDA and Bob Nichols.

There are 300,000 edible plant species, but just three (rice, maize, wheat) comprise 86% of all exports. According to Professor Victoria Jideani of Cape Peninsula University of Technology in South Africa, governments should subsidize agricultural diversity, such as the bambara groundnut, that can resist drought, support food security, and broaden the plant-based dietary options for a future-forward table. By 2050, 68% of the world’s people will live in cities. Land is limited, not only by population growth demands but also by agricultural needs. Optimal use of arable land will be one of the factors in balancing population, food security, and environment.

Bangkok, Thailand is a global megacity offering some of the tastiest food in the world, including legendary noodles. Image: “Food Stalls Bangkok,” by Ian Grattan, 2012. Wikimedia CC2.0. Included here with appreciation to Ian Grattan and Bangkok.

WhatIF Foods are currently sold in Singapore and produced in factories located in Australia and Malaysia, are sold in Asia, and in the regulatory approval process in the European Union. Privately financed, the company is now attracting investors. In the United States, you can purchase WhatIF products (noodles are just one of the products) online. Looking for instant noodle recipes? Here’s eight from eight countries.

Adetokunboh, Adeola, Anthony Obilana, Victoria Jideani. “Enzyme and Antioxidant Activities of Malted Bambara Groundnut as Affected by Steeping and Sprouting Time.” March 2022. Foods 11 (6): 783. DOI:10.3390/foods11060783

Cairns, Rebecca. “This Singaporean startup has reinvented the instant noodle.” 9 May 2022. CNN Business. https://www.cnn.com/2022/05/08/business/whatif-bamnut-sustainable-instant-noodles-climate-hnk-intl-spc/index.html

Cheetham, Peter and Christoph Langwallner, co-founders of WhatIF Foods. https://whatif-foods.com/

Jideani, Victoria. Cape Peninsula University of Technology, South Africa. https://www.researchgate.net/profile/Victoria-Jideani

United Nations Environment Programme. “#FridayFact: Every minute, we lose 23 hectares of arable land worldwide to drought and desertification.” 12 February 2018. https://www.unep.org/news-and-stories/story/fridayfact-every-minute-we-lose-23-hectares-arable-land-worldwide-drought

Building the World Blog by Kathleen Lusk Brooke and Zoe G. Quinn is licensed under a Creative Commons Attribution-NonCommercial-NoDerivs 3.0 Un

Print Friendly, PDF & Email

CITIES: Plastic – Part 2, The Producers

Cities are filled with plastic products – where are they made? Image: “Slovnaft – New Prolypropylene Plant” by Miklova. CC by 3.0. Wikimedia Commons.

Cities are the largest depositories of plastic products. Plastic was the largest category of waste disposal in Singapore in 2020 – 763,000 tons. Singapore recycles only 4% of its plastic waste. Other cities may do a bit better: San Francisco is the top city in the world for recycling. But we see only the end of the process.

“Global production and fate of plastics.” based on Geyer et al., 2007. With appreciation to Roland Geyer, Jenna R. Janbeck, Kara Lavender Law. Creative Commons 3.0, wikimedia.

Where do these products originate? It’s an enormous market – global sales of items manufactured in plastic reached $79 billion in 2018, and with growth of 8.5% per year since then. Europe set the highest value worth of exported plastic, with Asia and North America just behind. Plastic may grow to a $754 billion market by 2027 (unless the world does something soon to reduce the use of plastic). Plastic products may fill our cities, but where do they originate? Who are the producers?

TOP TEN PLASTIC PRODUCERS

Dow Chemical Company (coatings)

LyondellBasell (polyethylene and polypropylene)

ExxonMobil (olefins)

SABIC (polymers)

INEOS (food and product packaging)

BASF (world’s 6th largest manufacturer of plastics)

ENI (various plastics)

I.G. Chem (materials)

Chevron Phillips Chemical (polyalphaoelfins)

Lanxess (polymers)

Source: BizVibe 2022

The plastic you see, in your shampoo container or beverage bottle, is the end of the production process. It’s what you recycle: that’s part of the solution. Some consumer products, like beverage and cosmetic companies, are reducing their use of plastic packaging. But as we address plastic pollution, should we also concentrate on the origination?

Geyer, Roland, Jenna R. Janbeck, Kara Lavender Law. “Production, use, and fate of all plastics ever made.” 19 July 2017. Science Advances. https://www.science.org/doi/10.1126/sciadv.1700782

Oh, Tessa. “Explainer: Why Singapore’s plastic recycling rate is so low and what can be done to raise it.” 30 August 2021. Today. https://www.todayonline.com/singapore/explainer-why-singapores-plstic-recycling-rate-so-low-and-what-can-be-done-raise-it

“Top 10 Largest Plastic Manufacturing Companies in the World” BizVibe. 2022. https://blog/bizvibe.com/blog/plastic-manufacturing-companies

Building the World Blog by Kathleen Lusk Brooke and Zoe G. Quinn is licensed under a Creative Commons Attribution-NonCommercial-NoDerivs 3.0 Un


Print Friendly, PDF & Email

TRANSPORT: Linking the World

“Ancient Silk Road,” image: wikimedia commons.

The history of civilization may be measured by connection. First it was the Silk Road that connected cities; then it was the age of ships that created ports from Singapore to Suez.  Canals threaded connection through waterways, making one route from inland to sea: the Grand Canal, Canal des Deux Mers, Erie, Panama. Rail linked continents: the Trans-Continental, Canadian Pacific, and the Trans-Siberian united people across vast spans. But each of these achievements was a separate project.

“Belt and Road Initiative.” graphic design by Mathildem 16, 2020. Image: wikimedia.

BRI or B3W? Now, there are two plans to connect the world in a more comprehensive way: the “Belt and Road Initiative” (BRI) announced and begun in 2013 by China, and the “Build Back Better for the World” (B3W) proposed by the G7 in 2021. China is ahead: more than 100 countries have signed BRI agreements. Some comment that the BRI is able to move quickly from plan to construction of new ports linked to rail and road routes, and also express concern regarding resourcing: financial, human, and natural. But some say that the G7 could take inspiration from Charlemagne who united disparate groups through links of education, as well as land and sea. The G7’s B3W may include capital to fund areas like climate, digital technology, health security, as well as transport.

Will B3W make waves of change? “47th G7 2021 Waves Logo,” wikimedia commons.

Climate change will cause a new vision. It is certain that the world needs rebuilding: old bridges, ports, rail, and roads are in dire need of replacement, while new infrastructure could transform many places not yet linked. Some have cited the Marshall Plan as precedent to rebuilding and linking a new vision of the world. Others may see different possibilities that include contemporary concerns. As BRI and B3W consider terms of engagement and goals of success, is there an opportunity to link the world through the values of inclusion, peace, and sustainable resilience?  What is your vision of an interconnected world?

Ruta, Michele. “Three Opportunities and Three Risks of the Belt and Road Initiative.” 4 May 2018. World Bank Blog. https://blogs.worldbank.org/trade/three-opportunities-and-three-risks-belt-and-road-initiative

Sanger, Davi. E. and Mark Landler. “Biden Tries to Rally G7 Nations to Counter China’s Influence.” 12 June 2021. The New York Times. https://www.nytimes.com/2021/06/12/world/europe/biden-china-g7html?referringSource=articleShare

Building the World Blog by Kathleen Lusk Brooke and Zoe G. Quinn is licensed under a Creative Commons Attribution-NonCommercial-NoDerivs 3.0 Unp

Print Friendly, PDF & Email

WATER: Beach Weekend? Biodegradable Flip Flops

“Pristine Beach on the Soline Peninsula,” 2011. Photographer Alex Proimos. Image: wikimedia.

Labor Day 2020: for many it’s a beach weekend in flip flops. Too often, beaches are strewn with broken or discarded flip flops that litter the sand and pollute the water. Enter an innovation: biodegradable flip flops from the University of California San Diego and the California Center for Algae Biotechnology.

“Algae in pond, North Carolina.” Photographer: Ildar Sagdejev, 2008. Wikimedia.

Formula: take pond algae, dehydrate to a paste, extract lipids, run through series of chemical changes to produce polymers, pour resulting material into a mold. Present product, manufactured in partnership with Algenesis Materials, is 52% biodegradable and 48% petroleum; by 2025, the flip flops will be 100% made from renewables. If you do leave your flip flops at the beach, they’ll biodegrade and compost in 18 weeks.

Biodegradable flip flops will go on sale in 2021. Image: wikimedia.

It’s the world’s most popular shoe. Over three billion people wear only flip flops, but the footwear lasts only for about two years and is then discarded, eventually entering the world’s waters. East African beaches see 90 tons of discarded flip flops each year. Three billion flip flops end up in waterways and oceans every year. UniqueEco recycles old flip flops into toys; Terracycle shreds them to use for manufacturing picnic benches.  DIY Dreaming uses old flips to make dog beds. Okabashi makes recyclable sandals, and Splaff and Sanuk use natural materials for footwear. But Algenesis may be the first to make flip flops from algae. The footwear industry generates $215 billion annually, and the plastic industry is worth $1.2 trillion. Algensis biodegradable flip flops will go on sale in January 2021.

California Center for Algae Biotechnology. https://algae.ucsd.edu/about/index.html

Elassar, Alaa. “Researchers create eco-friendly, biodegradable flip flops made of algae,” 23 August 2020. CNN.com. https://www.cnn.com/2020/08/23/us/uc-san-diego-algae-flip-flops-trnd-scn/index.html

Frerck, Robert. “Flip Flop Factos: Find Out.” Blue Ocean Network. https://blueocean.net/flip-flop-facts-find-out

Segran, Elizabeth. “How one lab is turning algae into flip-flops – and taking on Big Plastic in the process.” 8 August 2020. Fast Company. https://www.fastcompany.com/90543908/how-one-lab-is-turning-algae-into-flip-flops-and-taking-on-big-plastic-in-the-process/

Building the World Blog by Kathleen Lusk Brooke and Zoe G. Quinn is licensed under a Creative Commons Attribution-NonCommercial-NoDerivs 3.0 Unp

Print Friendly, PDF & Email

CITIES: Open windows, lower noise

The New York Times Building in New York City. Image: wikimedia.

During the virus pandemic, opening the windows of a building can help. But urban denizens often keep windows closed to block out city noise. Singapore, a city built on innovation, has developed a solution. A team of scientists including Masaharu Nishimura and Bhan Lam from Nanyang Technological University have developed a device that, when placed in an open window, lowers incoming sound by 10 decibels. Think noise-cancelling headphones for your apartment: the inventors call it the Anti-Noise Control Window. By 2030, 60% of the world’s people will live in cities. Megacities (urban centers of more than 10 million people) are increasing; in 1960, there were just two (New York and Tokyo), but now there are 33. That’s a lot of windows.

World’s Megacities by Population:

Tokyo, Japan – 37 million

Delhi, India – 28 million

Shanghai, China – 25 million

São Paulo, Brazil – 21 million

Mexico City – 21 million

Cairo, Egypt – 20 million

Mumbai, Inda – 20 million

Beijing, China – 19 million

Dhaka, Bangladesh – 19 million

Osaka, Japan – 19 million

New York-Newark, USA – 18 million

Karachi, Pakistan – 15 million

Buenos Aires, Argentina – 15 million

Chongqing, China – 14 million

Istanbul, Turkey – 14 million

Kolkata, India – 14 million

Manila, Philippines – 13 million

Lagos, Nigeria – 13 million

Rio de janeiro, Brazil – 13 million

Tianjin, China – 13 million

Kinshasa, Democratic Republic of the Congo – 13 million

Guangzhou, China – 12 million

Los Angeles – Long Beach – Santa Ana, USA – 12 million

Moscow, Russia – 12 million

Shenzhen, China – 11 million

Lahore, Pakistan – 11 million

Bangalore, Inda – 11 million

Paris, France – 10 million

Bogota, Colombia- 10 million

Jakarta, Indonesia – 10 million

Chennai, India – 10 million

Lima, Peru – 10 million

Bangkok, Thailand – 10 million

Source: “The World’s Cities in 2018” United Nations.

While urban windows, when open, may still have to contend with air quality and pollution, the world’s largest cities may soon have a source of breeze and quiet with this very scalable innovation.

Lam, Bhan, Dongyan Shi, Woo-Seng Gan, Stephen J. Elliott, Masaharu Nishimura. “Active control of broadband sound through the open aperture of a full-sized domestic window.” 9 July 2020, Scientific Reports 10, Article number 10021 (2020). https://www.nature.com/articles/s41598-020-66563-z?referringSource-articleShare/

Waldstein, David. “Scientists Say You Can Cancel the Noise but Keep Your Window Open.” 11 July, The New York Times. https://www.nytimes.com/2020/07/11/science/windows-street-noise.html/

Young, Angela “The World’s 33 Megacities.” MSN. http://a.msn.com/00/en-us/BBUaR3v?ocid-se/

Building the World Blog by Kathleen Lusk Brooke and Zoe G. Quinn is licensed under a Creative Commons Attribution-NonCommercial-NoDerivs 3.0 Unp

Print Friendly, PDF & Email