Upcoming GPR survey Continue reading

June 10, 2024
by John Steinberg
2 Comments
June 10, 2024
by John Steinberg
2 Comments
Upcoming GPR survey Continue reading
October 25, 2019
by katherinealbert001
0 comments
Archaeology Month at the Fiske Center By Kati Albert Happy October and happy Massachusetts Archaeology Month to all who follow the Fiske Center and UMB Archaeology! To speak very personally, I love archaeology month. I see it not just an … Continue reading
January 14, 2019
by John Steinberg
0 comments
By John M. Steinberg & Grace E. Bello As we said in our previous post, the City Archaeologist, Joe Bagley asked us at the Fiske Center if we could conduct a geophysical survey over the area of Langone Park that, 100 … Continue reading
January 13, 2019 by gracebello001 | 0 comments
By Grace E. Bello & John M. Steinberg

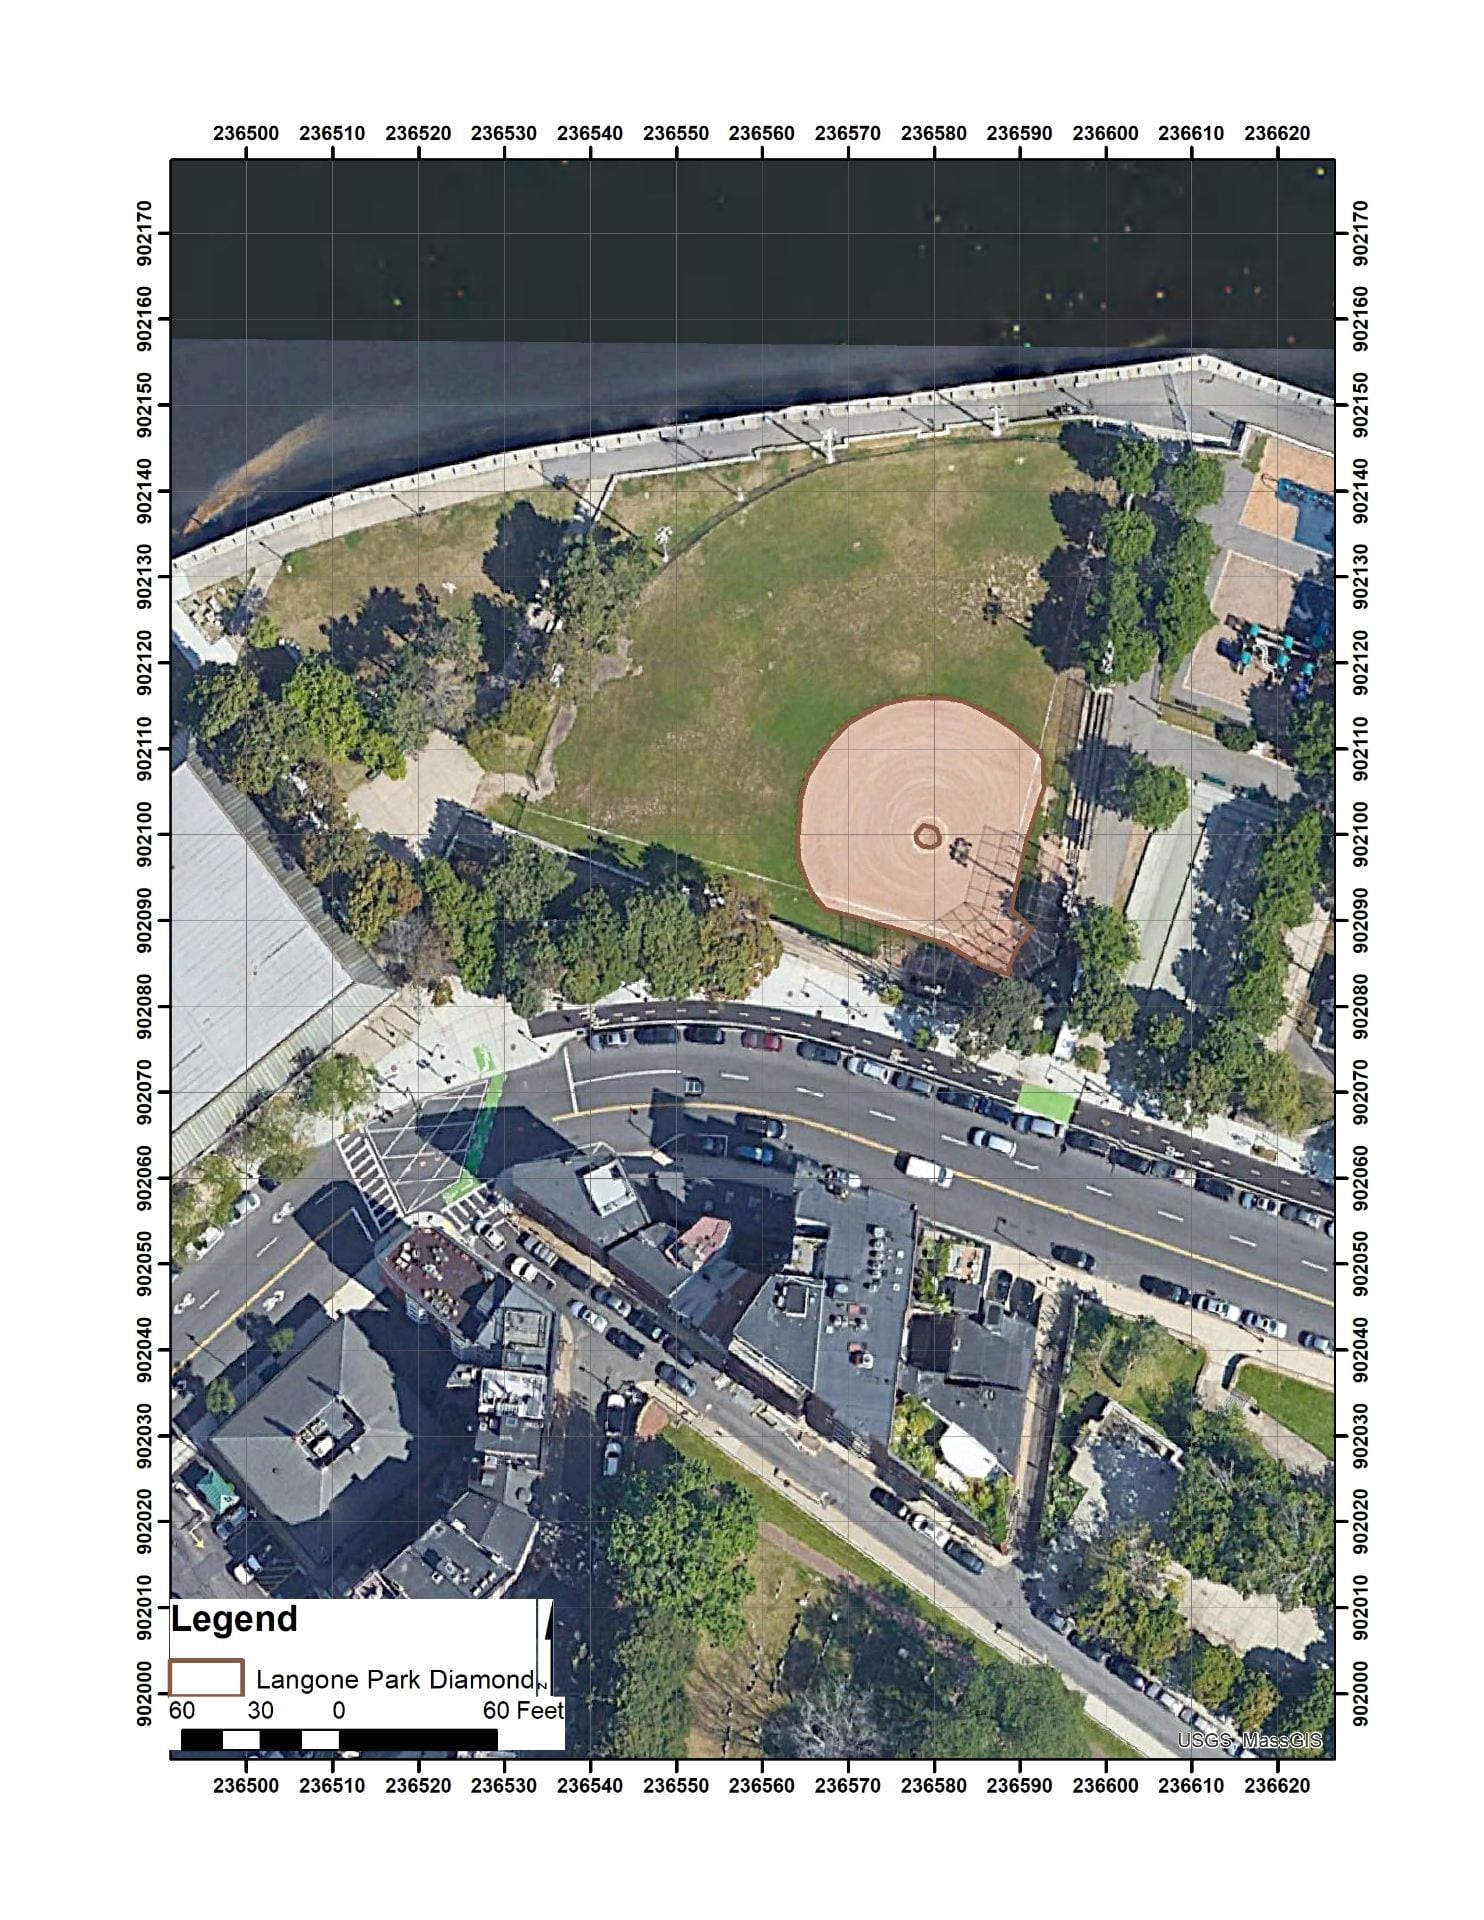
Areal image of what the waterfront looks like today.
The City Archaeologist, Joe Bagley, asked us at the Fiske Center if we could conduct a geophysical survey over the area of Langone Park that, 100 years ago, had a tank which ruptured and caused The Great Molasses Flood of 1919. This is in preparation for Tuesday January 15th, the 100th anniversary of the disaster.
For our archaeological geophysical survey we used two common techniques: ground penetrating radar (GPR) and electromagnetic (EM) conductivity. The results will be presented in the next post.
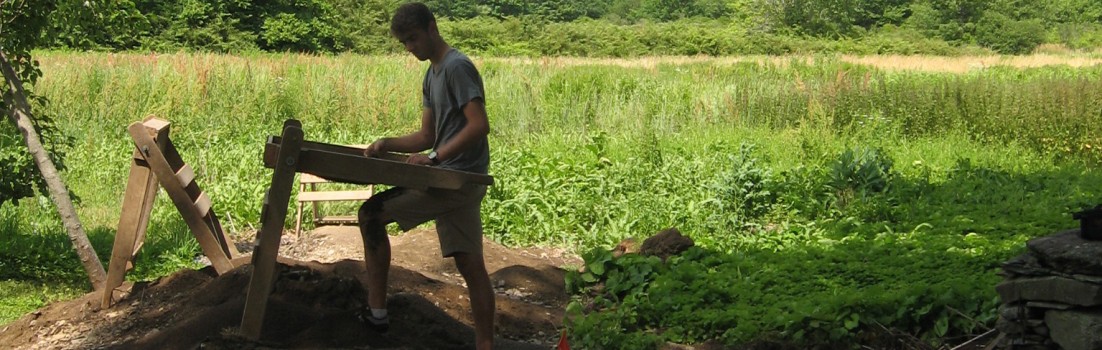
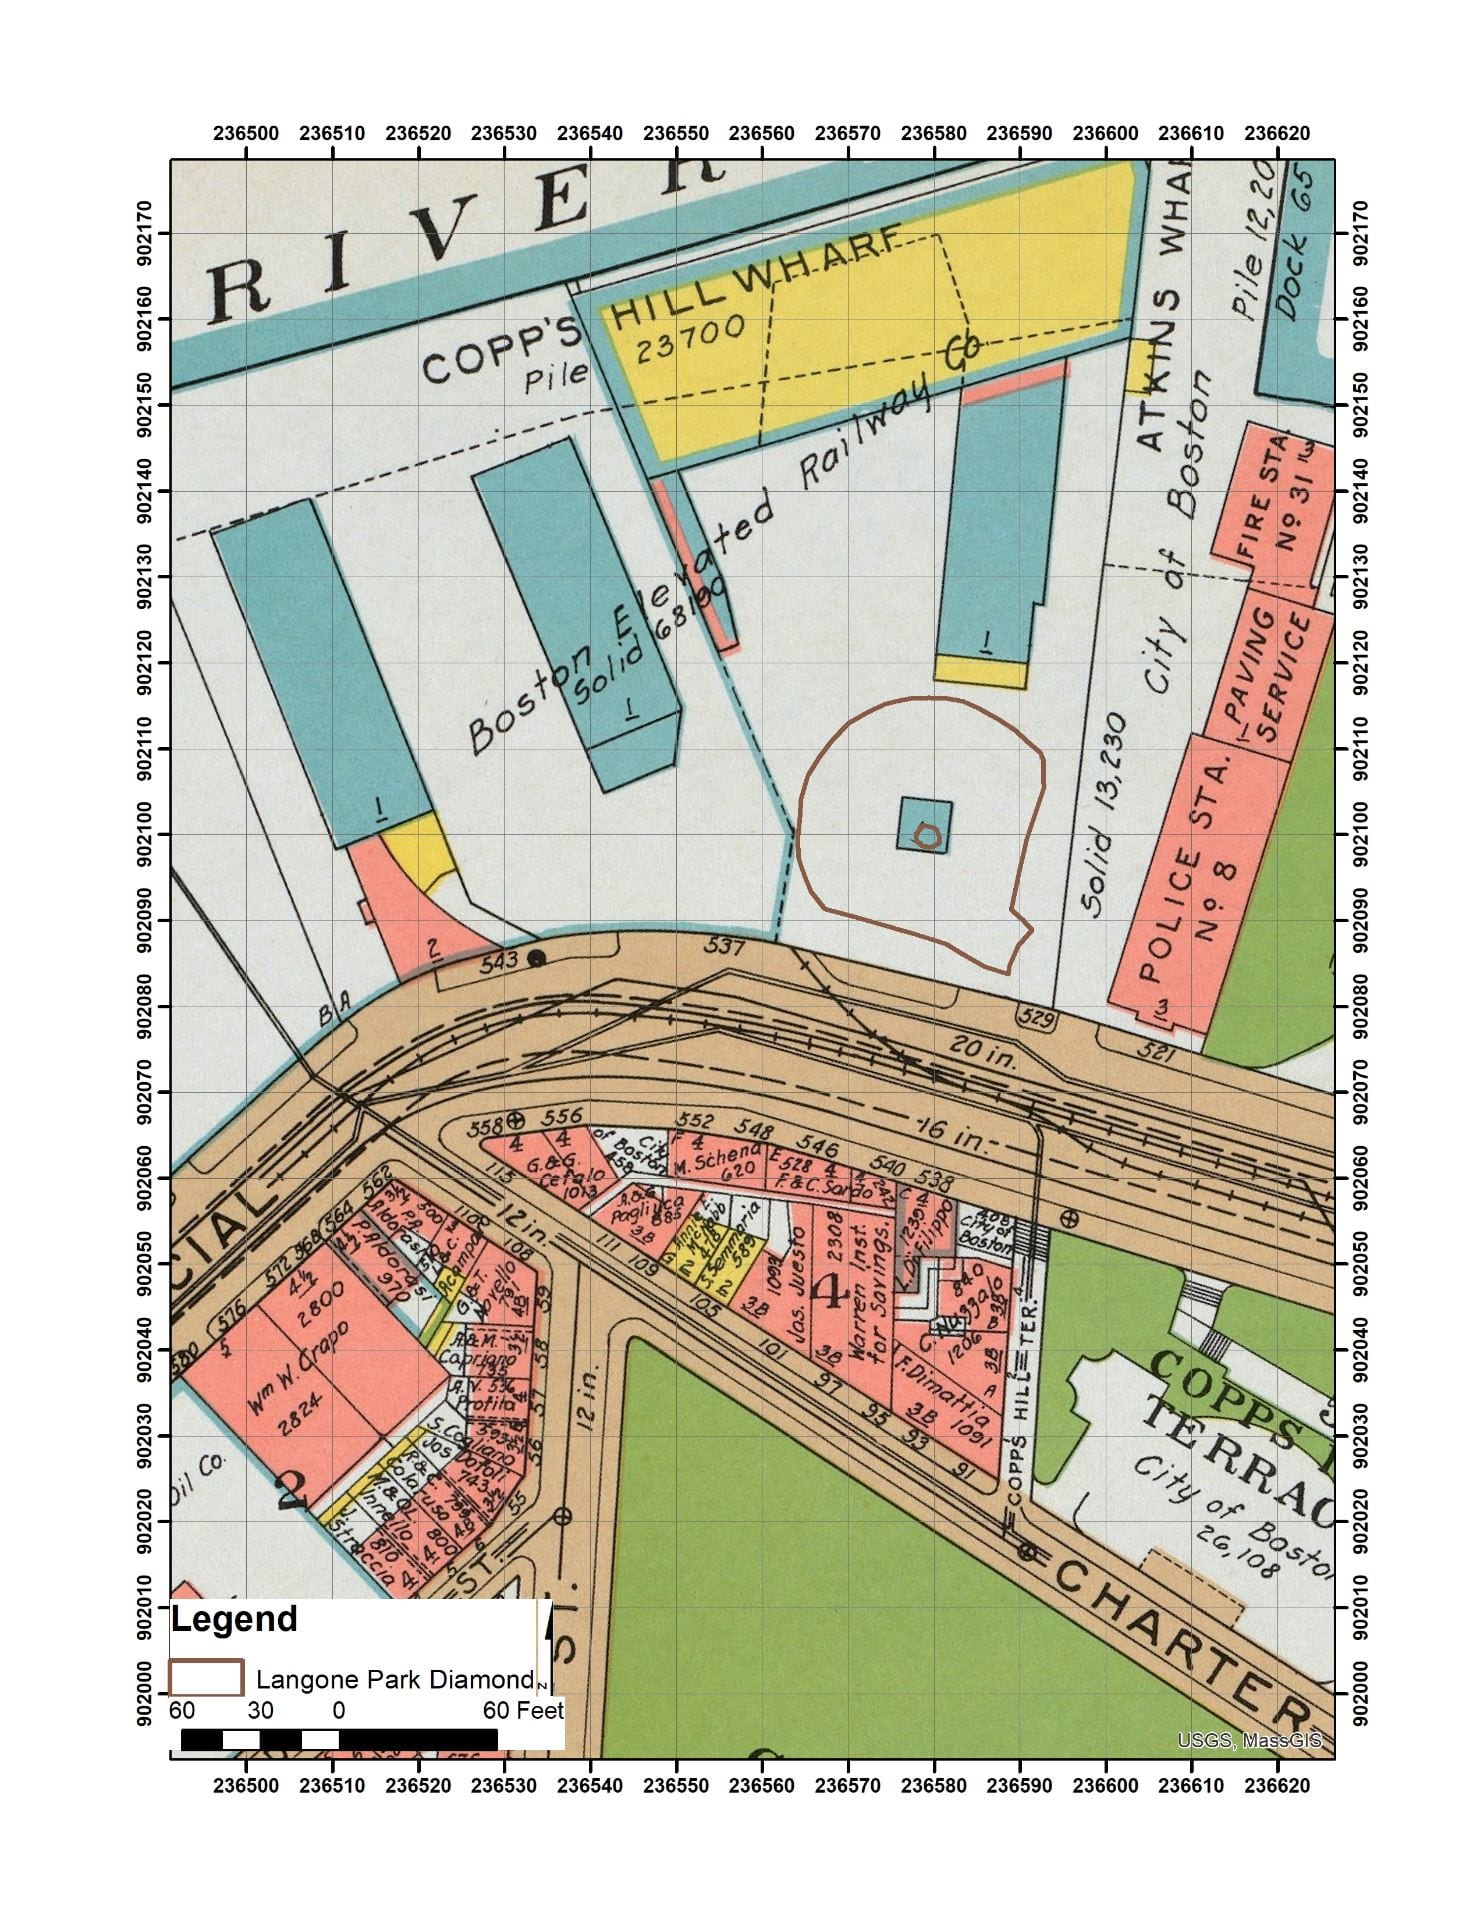
Before we interpret the results of a geophysical survey, we try and georeference every map we can of the area in question. The georeferenced maps allows us to better understand the geophysical results. Thus, below is a sample of some of the many maps that we looked at, to understand the complex history of this park. Today, the park has a little league / softball diamond, and the outline of that feature is shown in brown on each of the georeferenced maps (which are mostly from the Norman B. Leventhal Map & Education Center at the Boston Public Library). In Mark Shanahan’s great article in the Boston Globe Magazine, you can see a georeferenced 1917 map showing that the location of the tank is in the general area of the diamond. However, the Wikipedia map shows a smaller tank more north and a building between the tank and Commercial street. Joe Bagley wanted us to see if we could refine the location of the tank that ruptured in 1919. Over time, maps generally become more accurate, but just how accurate, and how well out team has georeferenced them is and issue that we study intently. Geophysical results can sometimes help us better georeference the maps and understand what parts are accurate, and what parts might require a little change. This is akin to the work we have been doing in Plymouth, combining geophysics and georeferenced maps, getting ready for the 400th anniversary of that colony.

1775 Map depicting the shipyard that occupied the area where the tank collapse
The landscape of Boston has been altered heavily over the past four hundred years. The evolution of Boston’s landscape is evident in historic maps that depict the city’s waterfront property. Maps, such as the ones shown in this sequence, are extraordinarily important sources of data about the past. These maps detail the dynamic history of the North End in Boston.
The Great Molasses Flood of 1919, took place in a relatively small portion of the North End’s extensive history and has hardly left a mark on the landscape. The flood occurred on January 15th, 1919, when a 50 ft. tall and 90 ft. in diameter molasses storage tank, owned by the Purity Distilling Company, collapsed. The collapsed tank then tipped over creating a wave of molasses close to 25 ft. tall which killed 21 people and injured up to 150. Today this is what the area looks like.
1814 Map. surveyed by J.G. Hales ; J.R. & Penniman.
Starting with the 1722 Captain John Bonner map of the, then, town of Boston, which shows the then active docks that occupied much of the Boston shoreline. This map was a monumental beginning to modern cartographic detailing that documented Boston’s shoreline. The docks, that are clear in the 1722 map, suggesting dry and wet docks in the 18th century. In a redrawn 1775 map, the area where the tank was located in the 20th century, was occupied by Hunts and Whites Ship yard. In this georeference, the park diamond is centered on the “ar” of Ship Yard.
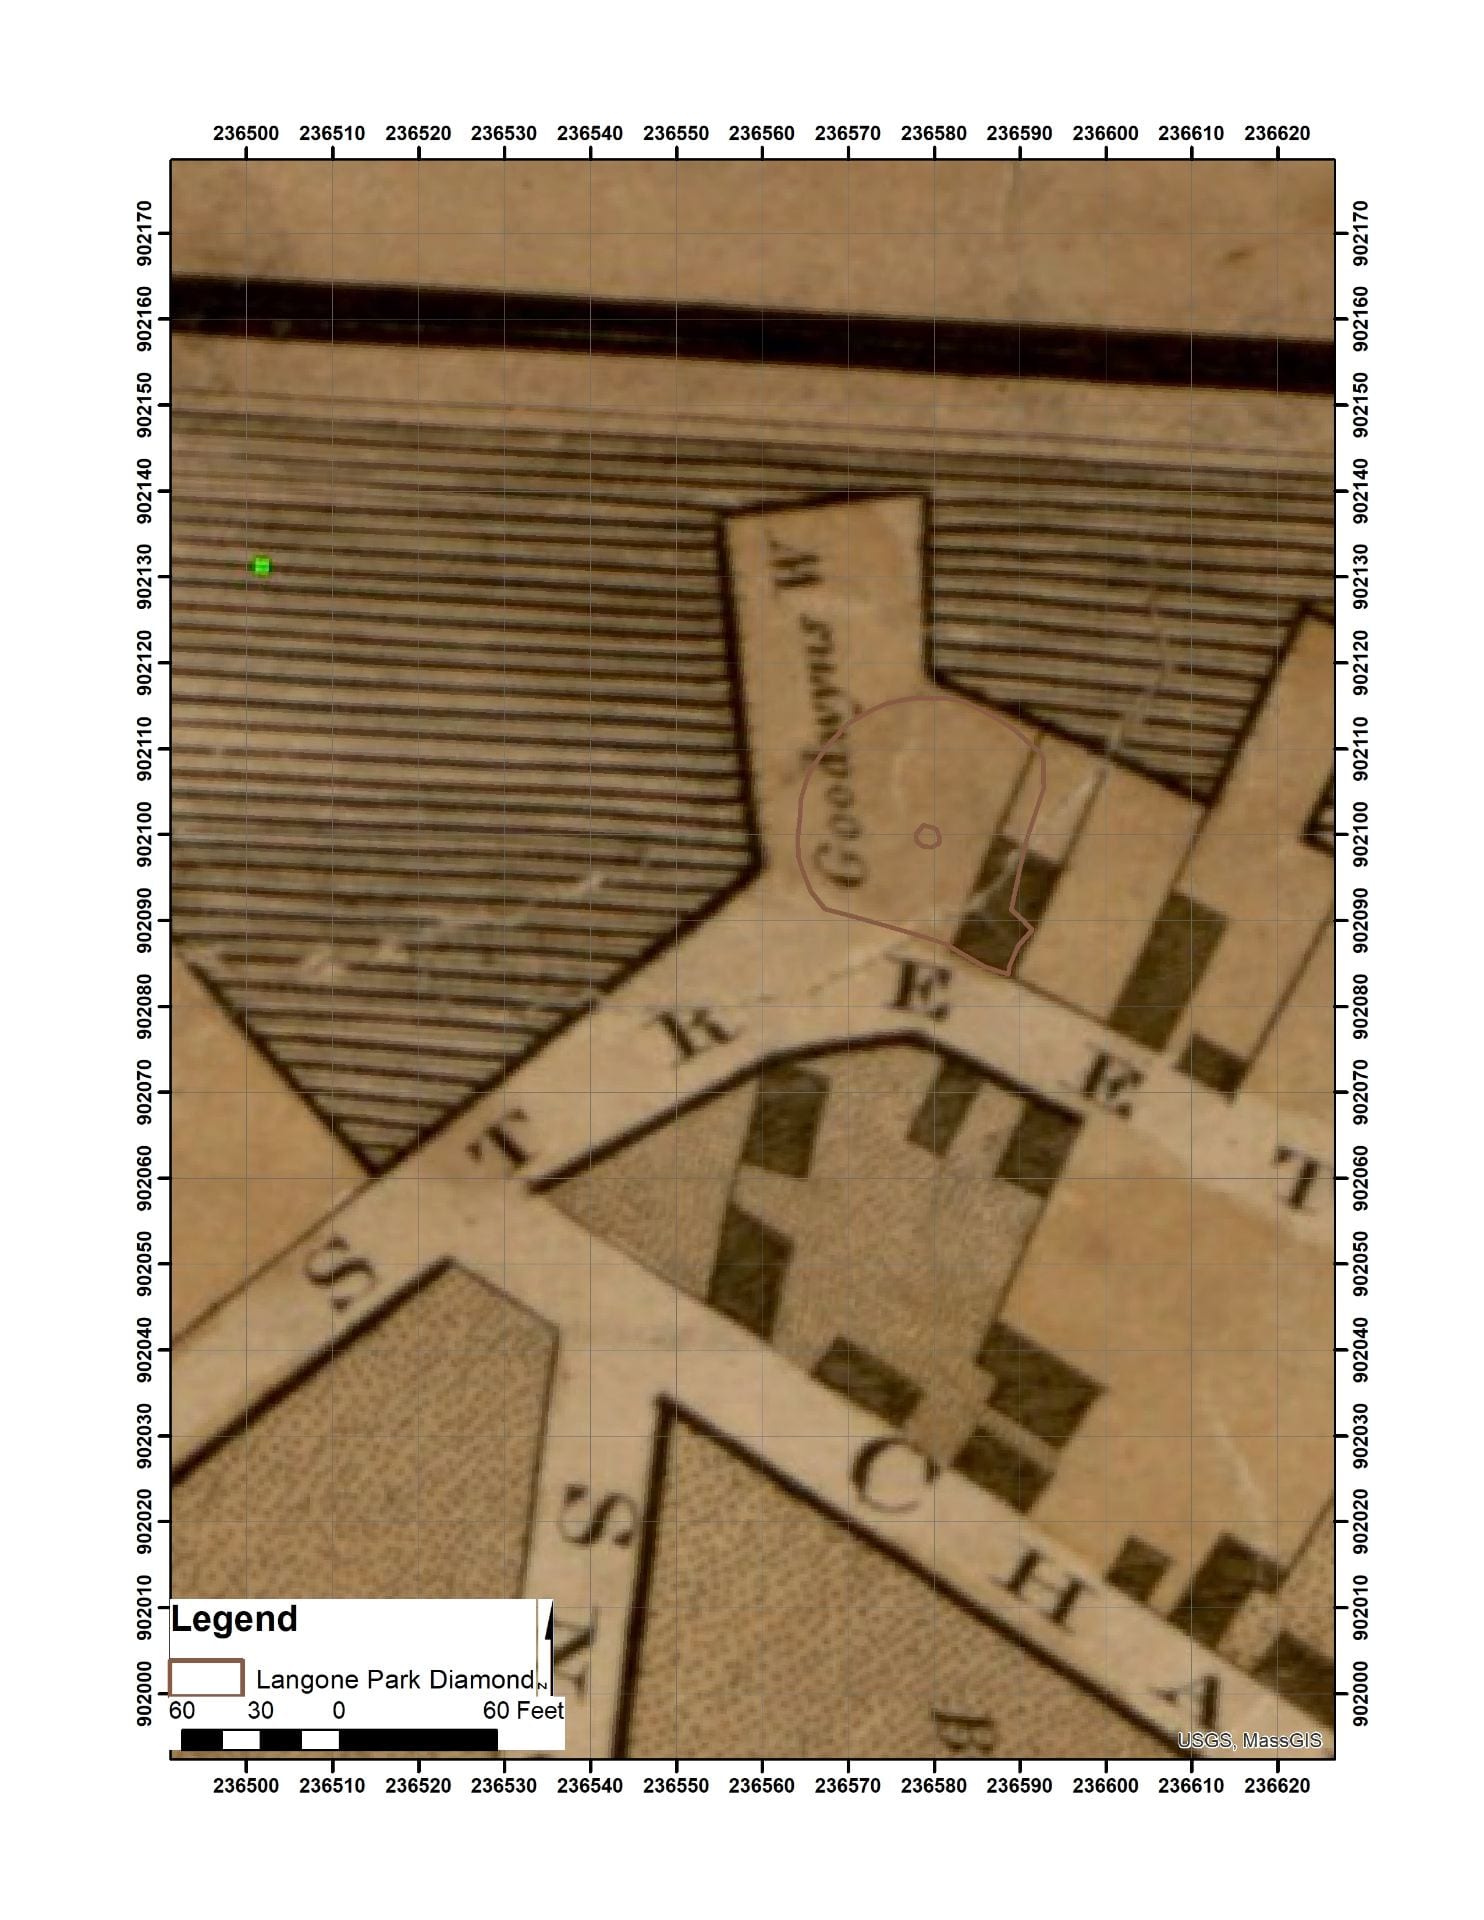
In an 1814 map, Commercial Street was labeled Lynn Street and the softball diamond seems to be on the mostly dry land with a building to the east. According to an

1852 Map surveyed and drawn by J. Slatter & B. Callan.
1852 map the adjacent street is now Commercial Street and a substantial amount of land has been added in the form of docks. It is not clear if the building along the first base line is the same one depicted in the 1814 map, but certainly the building curving around 3rd base seems to be new. The two border lines
1861 map made by Boston City Council, city engineer James Slade
coming together at the pitching mound may be visible in some of the geophysics, and will be seen in many of the later maps.
The same basic configuration is also visible in the 1861 map, made by the City.

1867 Sanborn Insurance map of Boston : volume 1 : plate 1
Cartographer: Daniel Alfred Sanborn
An 1867 map is the first real detailed map of the area. It is also one of the early famous Sanborn fire insurance maps. It shows several coal sheds and hints that the building along the first base line, first seen in the 1814 map, might still be there 50 years later.
George Washington Bromley 1890 map
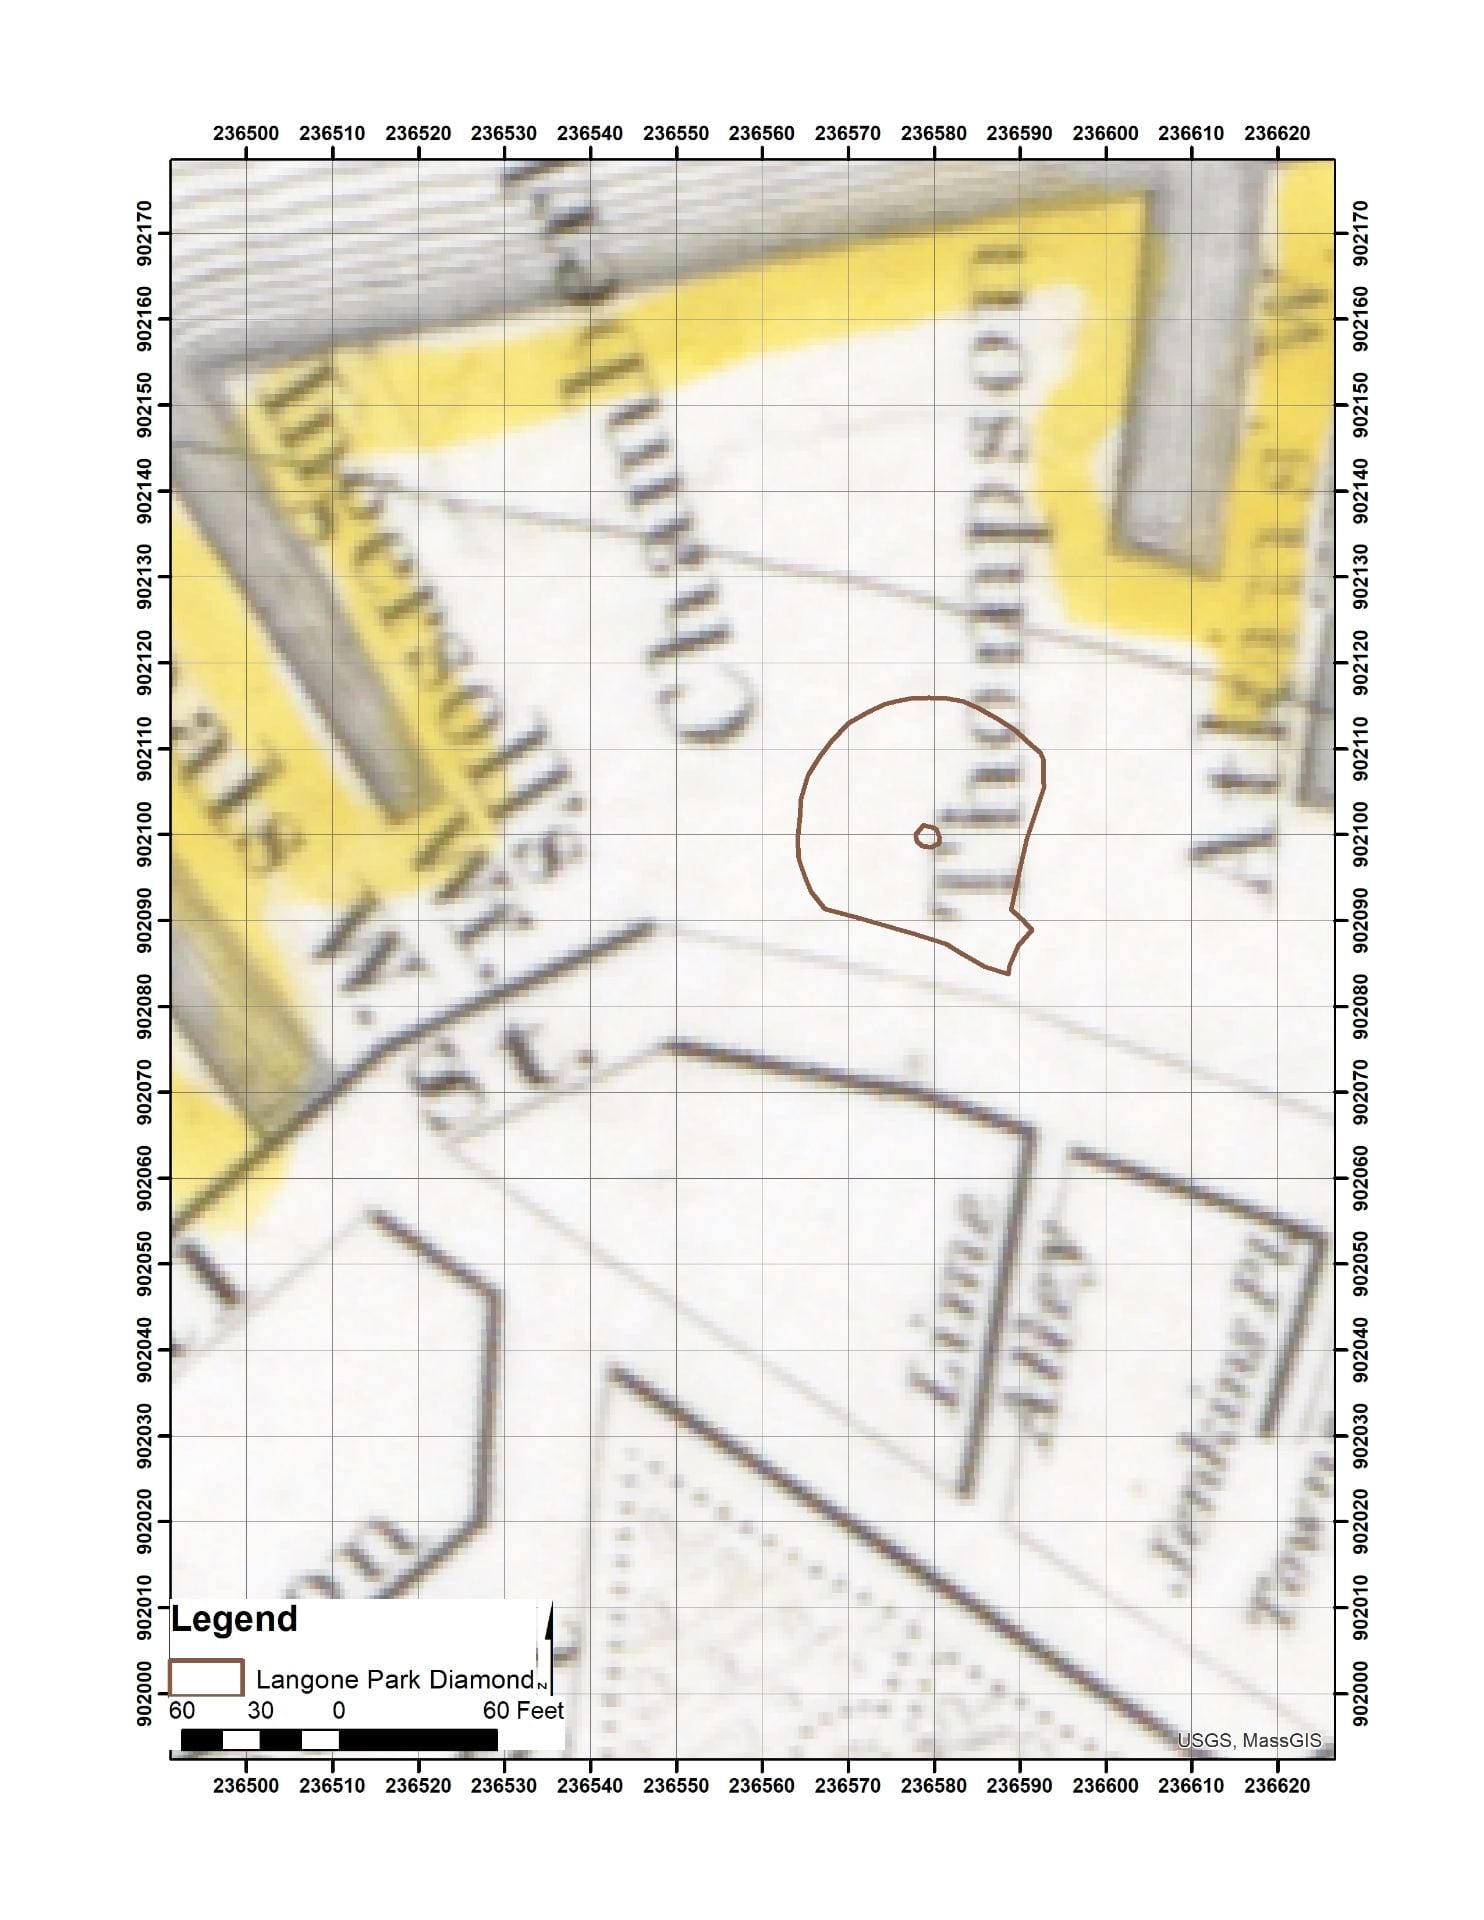
The 1890 Bromley map suggests that the “V” of two docks, meeting at the pitchers mound, first seen in the 1852 map, is still present but that the building that used to be along the first base line, is now substantially larger. The docks are also very different. A image of these kinds of docks can be seen in the birds eye view of downtown Boston dated 1877. These docks were an active hot spot for landscape change during
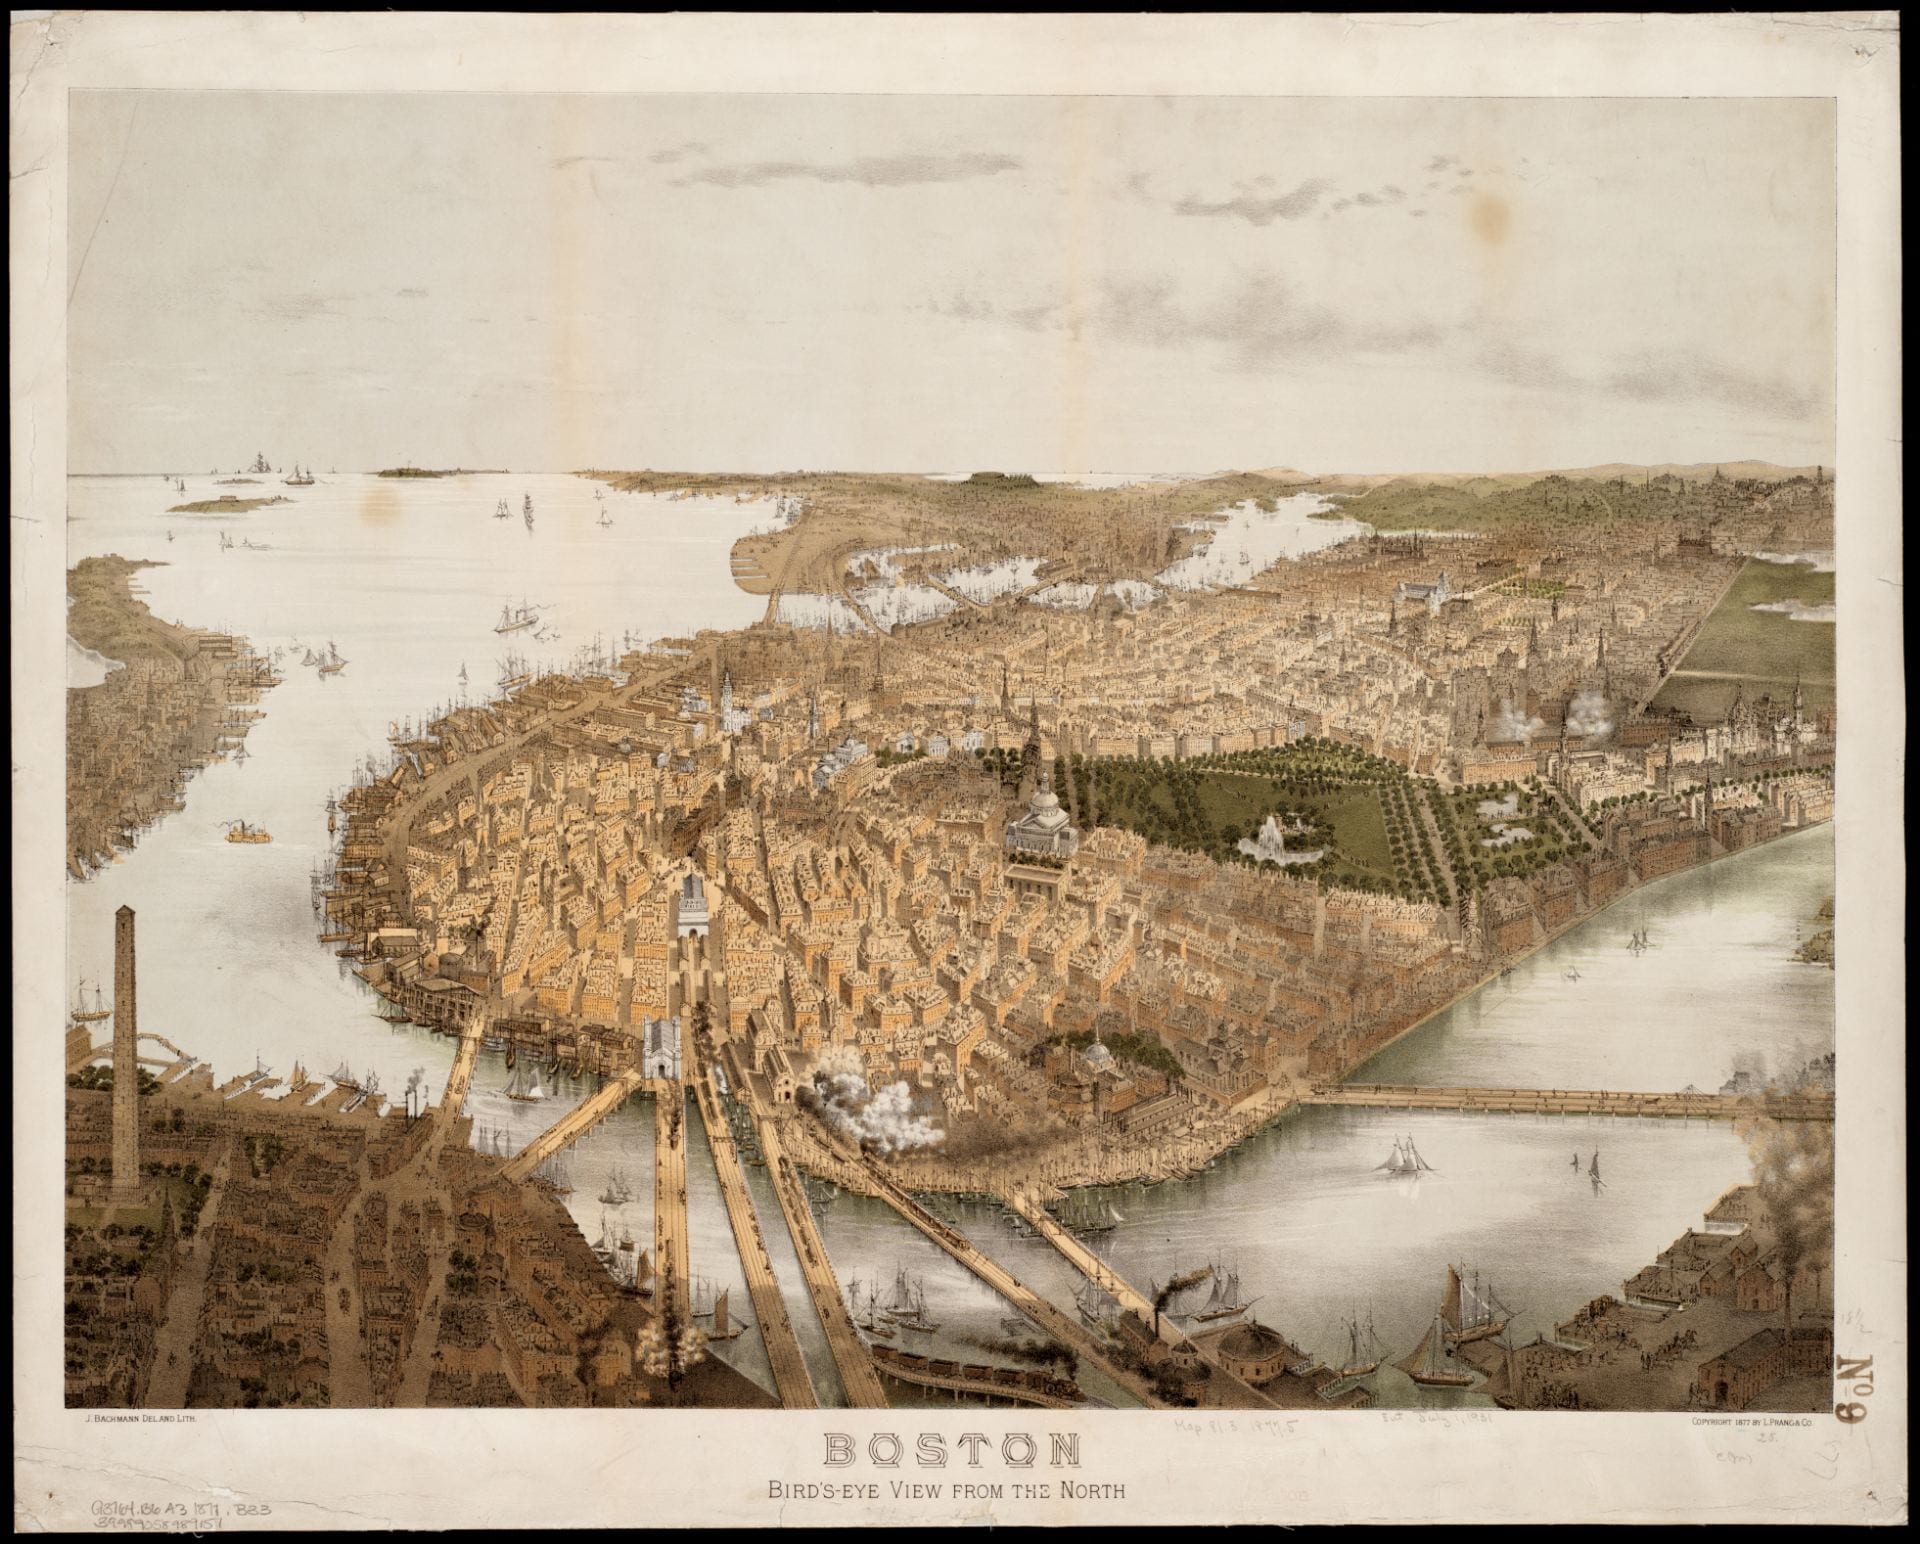
Bachman 1877 birds eye view
the 18th and 19th centuries. Further construction of larger docks and land masses were very common during these centuries by building cribbing or sinking ships to artificially fill in the harbor
By the 1908 map, the lot will take on the

1908 George Washington Bromley map
basic shape, the distilling company is labeled as the owner, and a small tank is indicated in the middle of the lot.

1912 George Washington Bromley map
This may be where the Wikipedia map gets its layout. In this initial 1908 map one large building can be seen in pink that is replaced by multiple buildings in the following 1912 map. The 1912 map shows a similar small tank but smaller building on Commercial St, and tracks going into the adjacent lot. To the right of the new park area is the soon to be location of the Purity Distilling Company which seems to have built larger molasses tanks as the business grew. This map shows the first distillery’s tank with two new buildings along side a new above ground railway.

1917 Bromley Map probably showing the tank before destruction.
A 1917 map shows the distillery buildings and the large molasses tank before the accident. The 1917 map is what we will base much of our interpretation on. It almost surely shows the large molasses tank that burst during the 1919 disaster as well as two new buildings. This is the final map that the distillery appears on. A 1922 map shows the absence of a distillery and tank, replaced with reused buildings by railway operations. Our final map, from 1938, again shows all of the buildings in the 1917 map, with the addition of a small shed where the pitcher’s mound is today. In 1973 Langone park was created.

1922 Bromley map
1938 Bromley map
In our next installment we will present the geophysical results from Langone Park.
November 27, 2018
by gracebello001
0 comments
Our work with the Cape Cod National Sea Shore continues as we monitor erosion trajectories. This 3-D model was built to aid in quantifying beach erosion over time. While the data is collected for purely scientific reasons, I made a fly … Continue reading
August 22, 2018
by Fiske Center
2 Comments
This summer Anya Gruber and Elizabeth Tarulis, graduate students in UMass Boston’s Historical Archaeology program, have been working at Plimoth Plantation to digitize the Allerton/Cushman collection. This work is part of an ongoing collaborative project funded by a grant from … Continue reading
January 30, 2017
by Fiske Center
1 Comment
Archaeology has a preservation ethic, and in the US, the Federal Government plays a large role in preserving our shared cultural heritage, including archaeological sites, by virtue of owning land, especially in western states. A bill directing the Secretary of … Continue reading
January 24, 2017
by John Steinberg
0 comments
The Hill has published an article describing the Trump Administration’s plans for the 2017 budget. They explain that the plan is close to the Heritage Foundation’s “Blueprint” (summary and full document). The author, Alex Bolton, cites “Staffers for the Trump transition” as … Continue reading
December 23, 2015
by David Landon
0 comments
The Community Preservation Coalition has recently highlighted the use of Community Preservation Act funds to support archaeology in Massachusetts. One of their featured projects is our work on Nantucket at the Boston-Higginbotham House, a collaborative undertaking with the Museum of … Continue reading
November 10, 2015
by Fiske Center
0 comments
On Monday,November 16, 2015 at noon in McCormack, first floor, room 503 Drs. David Landon and Christa Beranek will talk about Project 400: 2015 Fieldwork on Burial Hill, Plymouth, MA Please join us and feel free to bring your lunch.