Project REACH students take on “Food Deserts”

Project REACH students walk into classroom for a community meeting after lunch.
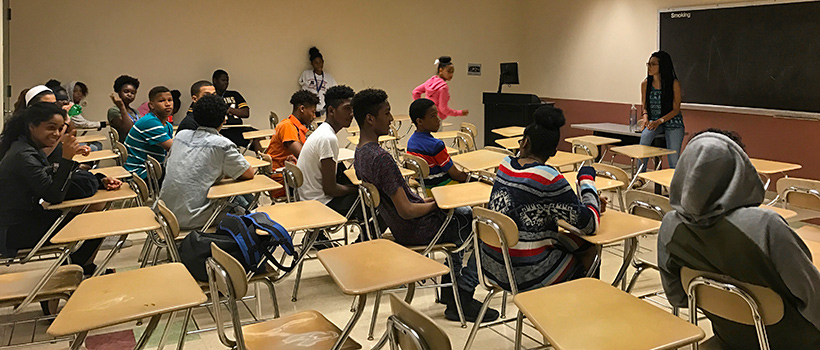
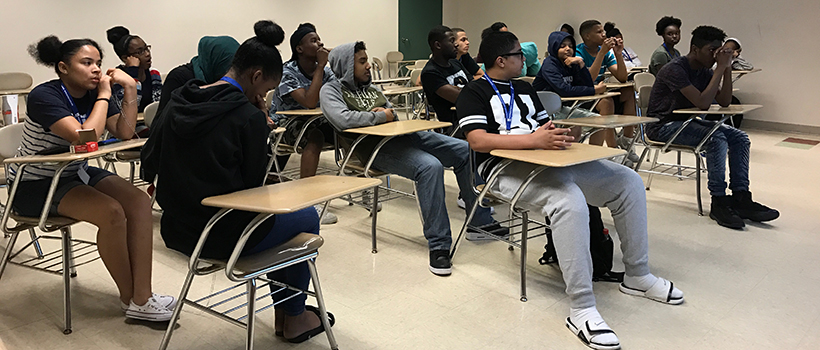
Students sit and wait for their peers to arrive before community meeting starts.
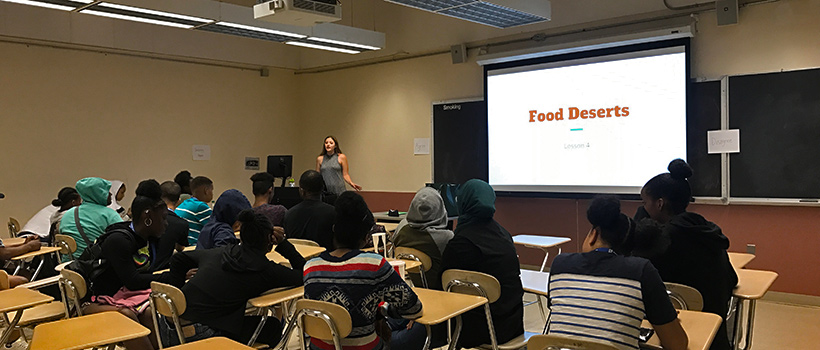
Project REACH students sit and get introduced to the term “food desert.”
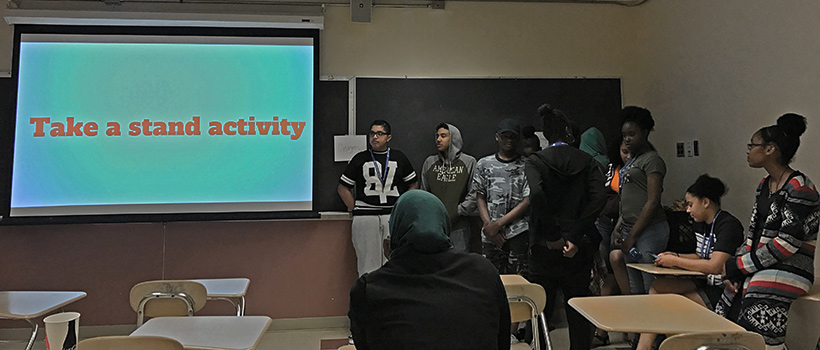
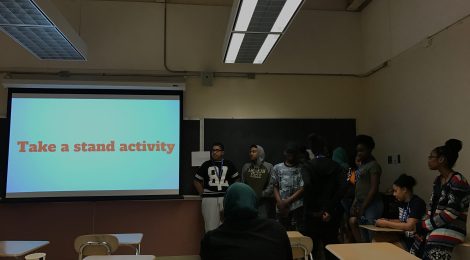
Students stand on “Strongly Disagree” side when statement “Everyone can get access to healthy food.”

Students from the opposite sides of the room agree with statement “Everyone has access to healthy food.” saying “people choose to eat what they want.”
Students tune in to see the dichotomy in the infographics that show how many grocery stores there are around Boston vs. how many corner stores are in and around Boston.

Students unpack what food security looks like in America.
Are you ready to unpack the disparities in what holds some communities back?
Until next post!
