A geophysical survey is frequently the first intensive, visible, field component of a project, and photographs of the survey in progress often are shared on social media to announce the start of the field season (Fig. 1). But what about the results of the geophysical surveys? These results, the discussion of how the geophysical survey guides the placement of excavation areas, and an evaluation of the geophysical data and the excavation results in tandem often come much later and are presented in technical reports, if at all. The aspect of the process that we would like to focus on here, using data from our ongoing project in Plymouth, Massachusetts, is one that is often only a part of unrecorded discussions among the project directors: how do we use the geophysical data when making decisions about placing excavation units?
Geophysics is often used when a structure or archaeological deposit is obscured by overlying material. A map (or some other visualization) of the variation in the geophysical readings is made. When placing excavation units, we look to places where there is a strong contrast between nearby readings, which are called anomalies. For various reasons (limited resources, preservation ethic) it is not practical or desirable to test all of the geophysical anomalies. Conversely, since not all important archaeological deposits will be detected as geophysical contrasts, excavations cannot ONLY target geophysical anomalies. On the site at Cole’s Hill, two of our five units were placed to test specific geophysical anomalies, one of which was a house cellar and foundation. The fact that the geophysical survey detected and defined these anomalies allowed us to test them very efficiently, then to confidently place additional units to avoid these features, which were not from our target time period. This strategy also balanced the archaeological testing so that it did not focus solely on the types of features that can be detected geophysically, allowing for the discovery of other significant features and deposits.
David Landon and I direct the excavations in Plymouth, and we are fortunate to be able to work with experts in archaeological geophysics, John Steinberg and Brian Damiata. Steinberg and Damiata set up the survey and excavation grid, conduct the surveys, and process the geophysical data. Their high quality surveys, with closely spaced (20, 25 or 33 cm) and accurately surveyed transects make the integration of geophysical survey and excavation data possible. Crucially, Steinberg and Damiata are often also present during and after the excavations to discuss the geophysical results, provide input on excavation targets, and later compare the excavation profiles and geophysical results. In the last 10 years, we have conducted geophysical survey and subsequent test excavations at a dozen sites or properties (some as large as a city block) in the northeast. Ground-penetrating radar (GPR) is the most common geophysical technique, though it is frequently paired with an electromagnetic conductivity or magnetometer survey.
Geophysical Survey on Cole’s Hill
In Plymouth, there are three areas where geophysical surveys have been followed with test excavations: an open lot at the edge of Jenney Pond, a block-length area along the edge of Burial Hill on School Street, and an open lot on Cole’s Hill (Fig. 2). This discussion will focus on Cole’s Hill, now owned by the Pilgrim Society (survey 2015; excavation 2016). This lot was the site of a two family house between ca. 1800 and 1920, when it was acquired by the Pilgrim Tercentenary Commission which removed the structure.
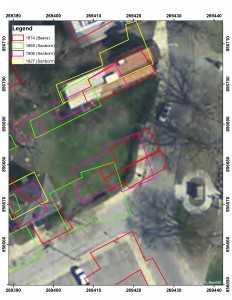
Figure 3. The building on the corner lot appears on three different historic maps (1874, 1885, and 1906). While the north-south difference between the different georeferences is relatively small, the location of the west wall varies by 15 meters.
Georeferenced historic maps (Fig. 3) that show the building’s outline disagree on its location fairly significantly (up to 15 m), and maps provide no information about other features that might have once been on the lot such as other houses, outbuildings, wells, privies, or trash pits. Our primary interest in this lot was to test for any evidence of 17th-century activity, predating all of the features that were specifically mapped on this parcel. In 2015, Steinberg and Damiata conducted GPR and frequency-domain electromagnetic (FDEM) surveys on this lot with transects spaced 20 cm apart (see Beranek et al. 2016: 20-27 for details on the instruments and post-processing software).
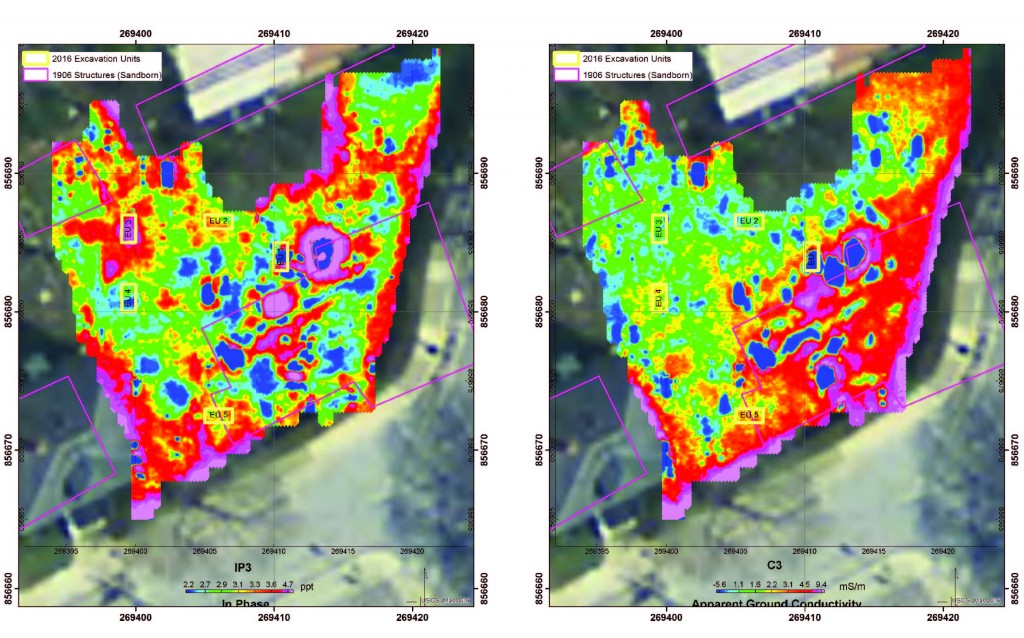
The GPR survey showed a roughly rectangular area in several slices between 23 and 100 cm below the surface that contained many strong reflectors (Fig. 4). In the slice at 47 to 73 cm bs, these appear as multiple discrete, linear anomalies. Knowing the history of the lot, we interpreted this area as the cellar and foundation of the ca. 1800 house on the property. Extending west of this area were two linear anomalies leading to two unknown features which we interpreted as possible pipes and cisterns, wells, or cesspools (Fig. 5). The other notable feature from the geophysical survey was an area in the northwest corner of the lot, away from any known buildings, that had a high value on the in-phase component of the FDEM survey (Fig. 6).
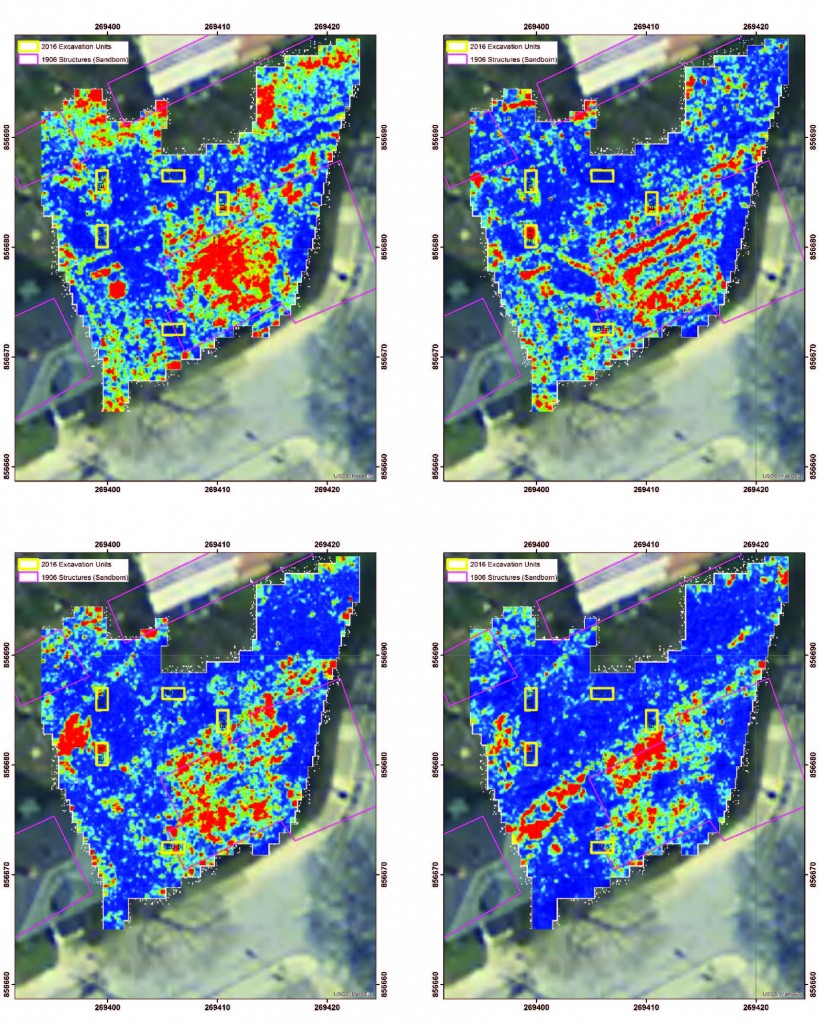
Figure 4. GPR slices at different depths: top) 23-50 cm and 47-73 cm; bottom) 70-100 cm and 97-125 cm. The excavation units are also shown, as is the outline of structure from the 1906 map for reference.
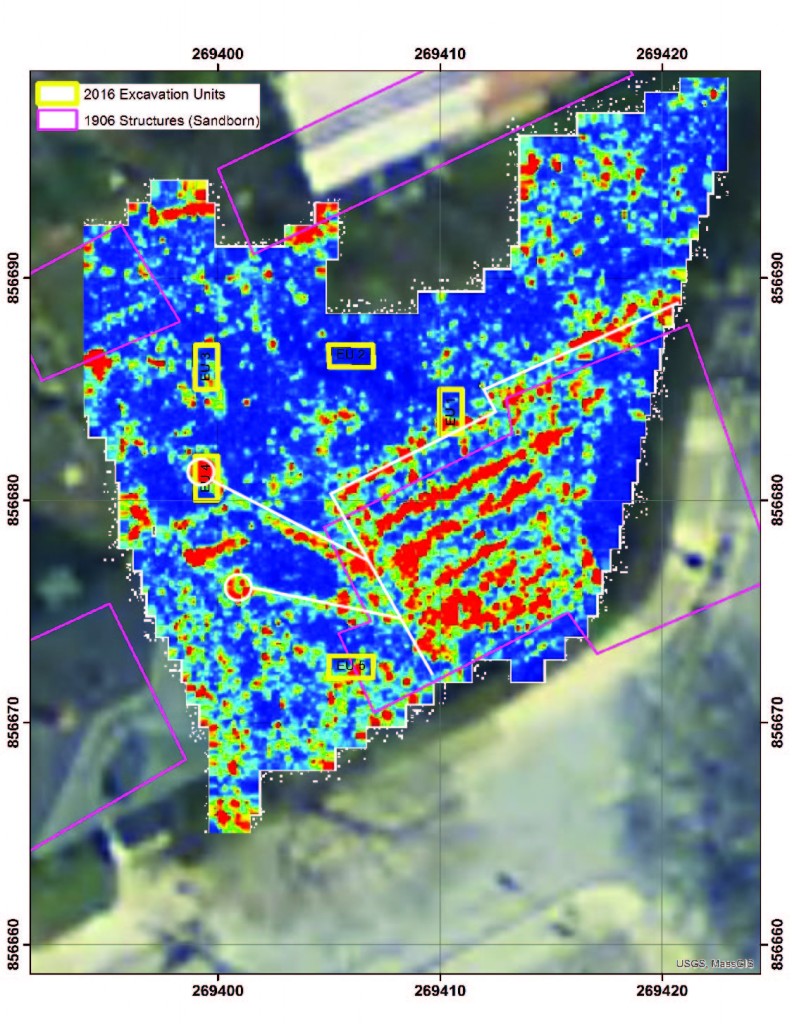
Figure 5. The 47-73 cm bs GPS slice with the reflectors that we interpreted as the house cellar, pipes, and cesspools highlighted in white.
Unit Placement
Local tradition, which has not been confirmed archaeologically, is that parts of Cole’s Hill were used as the burial place for the English settlers who died in the winter of 1620-1621. Because of this possibility, however remote, we decided not to excavate any shovel test pits on this lot but only to excavate 1 x 2 m units. This larger unit size helps ensure that we see enough of a feature to understand its type. Given our time and crew size constraints, we decided to place five excavation units on this lot. Our primary interest was in finding out if there were any features or deposits that predated the ca. 1800 house, so we wanted to target yard area outside the house and to avoid the house footprint.
To confirm the location of the house, we used the GPR results to place a single 1 x 2 m excavation unit oriented N-S to cross the north edge of the reflector that we interpreted as the building foundation (EU1). If we could pinpoint the location of the foundation, we would be able to concentrate our excavation efforts outside the building, rather than spending additional time on deposits in the cellar filled after 1920. We frequently use this method of placing a single unit to cross a long linear reflector, allowing us to test the deposits on both sides and to determine the nature of the anomaly causing the reflection. Here, the reflector did indicate the location of the wall of the house (Fig. 7). Also of note is that the general location of the house’s cellar is also visible in the deepest bulk conductivity (C3) map of the FDEM data (Fig. 6). The GPR results plus a single excavation unit allowed us to be more specific about the house’s location than any of the historic maps, thus making the remainder of our excavation, targeting the yard spaces, more efficient. This also confirmed which maps show the position of the north wall of the 19th-century duplex most accurately.
We also placed a single unit (EU4) to test the northern of the two presumed wells, cisterns, or cesspools so that we could determine the feature type. We uncovered a dry laid cobble cesspool with a stone cap that was still unfilled for 1.6 m below the cap. This unit helped us to interpret the two anomalies visible in the GPR results of the west yard as a pair of pipes and cesspools, one connected to each side of the duplex. Although the house was constructed ca. 1800, the land that the cess pools are on was owned by another household until 1843 (PCRD 207: 232), suggesting that these features were added after that date. Systematic testing might have encountered one of these features, though probably not both. Again, GPR survey and a single excavation unit proved to be a very efficient way to learn about and interpret the property’s waste and water management system. Getting a comparable amount of information by excavation alone would have entailed much more time, likely without providing much additional information.
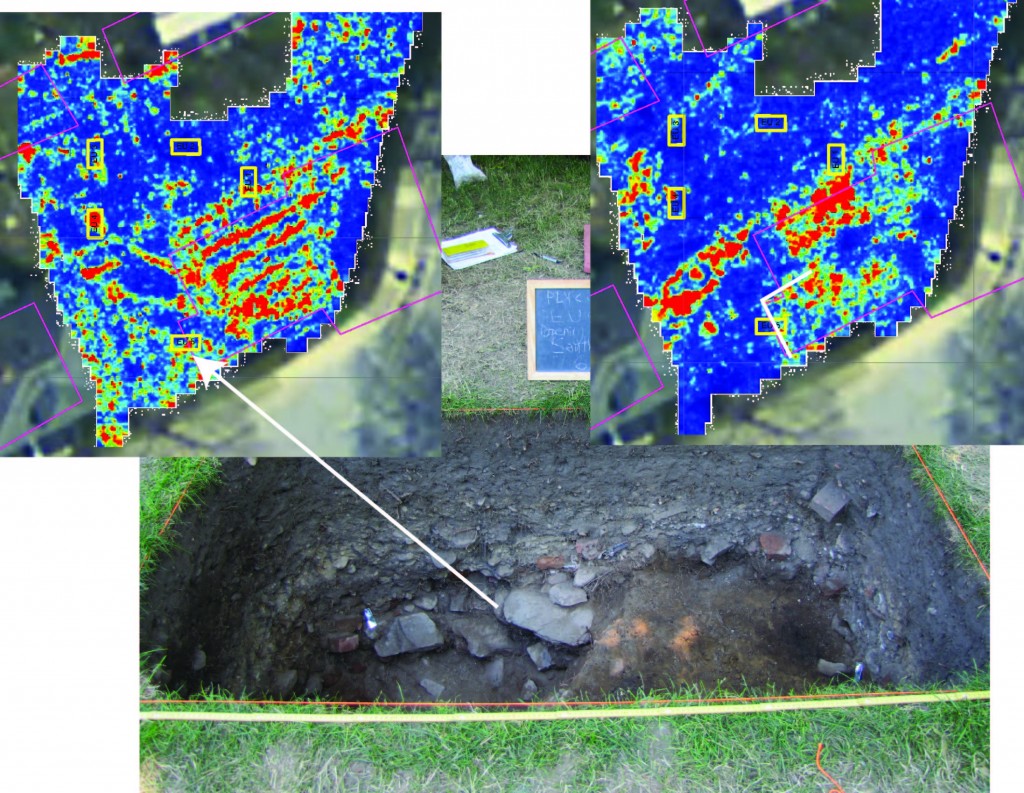
Figure 8. Edge of a filled cellar in EU5 with the 47-73 cm bs GPR slice (left) and 97-125 cm slice (right) with the edge of the cellar outlined in white. Note that although the georeferenced 1906 building corresponds with this cellar location, the cellar was filled by the mid 19th century and is from a different phase of the building than that depicted in 1906.
Since the GPR data allowed us to predict where the rear (west) edge of the house’s main cellar was located, we were able to place EU5 west of the cellar to test the area for trash deposits behind the house. The GPR was crucial in placing this unit because there was a 15 meter difference between where different georeferenced historic maps placed the rear wall of the known house, so we could not have used the maps alone to confidently place a unit outside of the house’s cellar. Note that the GPR did not rule out the possibility that this area was under an un-cellared portion of the house; it just maximized the possibility that it was not in the main cellar itself. EU5 was not placed to test any specific reflectors, although there are some non-patterned strong reflectors visible in some of the slices. This unit encountered the edge of a cellar hole of a previously unknown building filled with material from the first third of the 19th century, including a faunal assemblage suggesting that the deposits were part of a kitchen midden. The reflector visible on the 47-73 cm bs slice corresponds to a deposit of clay and displaced foundation stones slumped against the inside wall of the filled cellar. Knowing this, we went back to the GPR-Slice data and were able to trace the outline of this cellar which abuts or is truncated by the main cellar of the house (Fig. 8), and was clearly filled and sealed over while the house was still in use.
The final two excavation units (EUs 2 and 3) were deliberately placed in areas that did not have reflectors on the GPR slices. For these two units, we used the GPR data to help us avoid areas that definitely had 19th-century features. Many feature and deposit types do not appear as GPR reflectors, especially in urban conditions, so we wanted to ensure that not all units targeted reflectors . EU2, in the north yard of the house, contained dense kitchen midden layers dating to the 19th century, contemporary with the house, and a post hole and still partially intact wooden post, but no other features. EU3 was placed in an area where the FDEM showed an area of high value in the in-phase data (indicating high magnetic susceptibility) but again nothing in the GPR. The high FDEM values are probably explained by a concentration of slag in the upper strata that was not present in other units. Below these was a very rich and significant deposit, an intentionally dug pit into the subsoil filled with late 19th-century personal items, but not visible on the GPR slices.
Conclusion
The geophysical survey and excavation on Cole’s Hill illustrate the complimentary nature of geophysical and excavation data. The GPR survey on this lot was very successful in mapping anomalies that proved to be large features associated with the 19th and early 20th-century house and utilities on the lot. Defining these through excavation alone would have been labor intensive and unnecessarily destructive to the archaeological record. The GPR data enabled us to place units very specifically, and the combination of GPR and excavation data makes it possible for us to map and understand these large features. Armed with this information, other units could more confidently be located outside of the 19th-century house to investigate the yard space and look for earlier deposits. These units were placed based on the absence of GPR reflectors both because we wanted to avoid the 19th-century structure and to make sure that our excavations were not unduly biased towards the kinds of materials that appear best in GPR surveys.
References
Beranek, Christa M., David B. Landon, John M. Steinberg, and Brian Damiata, eds.
2016 Project 400: The Plymouth Colony Archaeological Survey, Public Summary Report on the 2015 Field Season, Burial Hill, Plymouth, Massachusetts. Andrew Fiske Memorial Center for Archaeological Research Cultural Resource Management Study No. 75a.
Davis, William T.
1899 Ancient Landmarks of Plymouth, 2nd edn. A. Williams and Company, Boston, MA.
Plymouth County Registry of Deeds
207: 232 William Cashwell to Henry and Edwin Jackson, 1843.


