 This article is one in a series of stories about how people across the country are using the Elder Index to understand the true cost of living for older adults and its economic implications. If you know someone who would like to receive information about these stories, send us a note at gerontologyinstitute@umb.edu.
Late this spring, New Jersey Gov. Phil Murphy faced a big problem that was all too familiar to other governors across America. The staggering economic impact of the COVID-19 pandemic had created a state budget crisis, with unemployment soaring and new annual revenue projections falling billions of dollars short.
Murphy approached the problem by moving back the start of New Jersey’s next fiscal year from July to October and passing a three-month stop-gap budget to tide the state over. Included in the short-term budget: Cuts to two important property tax-relief programs that help older adults in New Jersey afford to remain in their homes.
This was no small detail. New Jersey homeowners pay the nation’s highest property tax rates, about twice the U.S. average. Nearly 580,000 homeowners benefitted from one of the programs under the axe and 158,000 others took advantage of the other. Both programs primarily benefitted older homeowners and the combined impact of the cuts was expected to exceed $480 million.
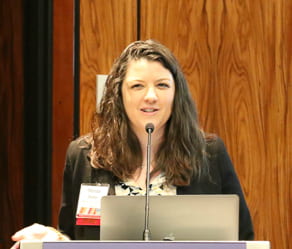
Melissa Chalker, executive director of the New Jersey Foundation For Aging, understood all that. Along with AARP New Jersey and other advocates, Chalker immediately launched a campaign to convince the governor and state legislators to restore the critical programs. One of her key tools in advocacy calls and letters: The Elder Index.
“All of these communications would reference the Elder Index,” said Chalker. “It not only allowed us to tell policymakers that 54 percent of older adults in New Jersey have difficulty making ends meet, but a recent related report showed how effective one property tax-relief program in particular was in reducing the economic security gap facing older adults in the state.”

Melissa Chalker
The index, developed and managed at the University of Massachusetts Boston, is a free online tool that provides realistic and detailed cost of living data for older adults living in every U.S. county. Combined with state-level income data, the index can also determine the percentage of older adults who have insufficient income to meet the cost of living in their states. UMass Boston’s Gerontology Institute published a report on state-by-state elder economic security last November.
The New Jersey Foundation for Aging and the Gerontology Institute have been working together for years to provide state and local leaders with clear data about the economic circumstances of their older citizens. The foundation helped promote legislation enacted in 2015 that requires an elder economic security report based on Elder Index data be maintained by state government as a public resource.
A companion report, prepared with Rutgers University and a consultant, analyzes racial and ethnic details in the data, as well other factors including the effectiveness of individual state programs in reducing elder economic insecurity.
“We want to constantly use the Elder Index to remind policymakers and people in state government that there is a need here with older adults,” said Chalker. “Whether it’s the SNAP nutrition program, housing or prescription drug prices, we’ve been able to send letters and testify at the statehouse on those issues stating the Elder Index data.
“We’ve also used it to arm our partners, whether they are funders, county office on aging staff or senior center staff to help them meet the needs of older adults in their communities,” she said.
But the foundation had always understood that housing expenses played an outsized role in New Jersey’s elder economic security problem. The online index can help anyone get sense of those dimensions in just a couple of clicks.
Here’s how: Enter New Jersey and national average queries for older couples in good health who own their own home without a mortgage. You’ll find total monthly expenses more than 20 percent higher in New Jersey, compared with the national average. Housing costs, almost double the national average in New Jersey, account for nearly all of the overall difference.

New Jersey Gov. Phil Murphy signs the state’s budget.
Data like that explain why Chalker and other advocates knew how important it was to save New Jersey’s property tax-relief programs. After a burst of calls, letters and op-ed columns, their efforts paid off last month. Murphy signed a new $32.7 billion budget for the remainder of the fiscal year, preserving both property tax relief programs for the future.
“I think the Elder Index was crucial in terms of the effort,” said Chalker. “You can anecdotally say how hard it is for seniors and tell some very compelling stories. But you’ve got to have metrics if you are making the case to policymakers and the elder economic insecurity reports provided what we needed.”

October 16, 2020 at 2:36 pm
Great to see this!