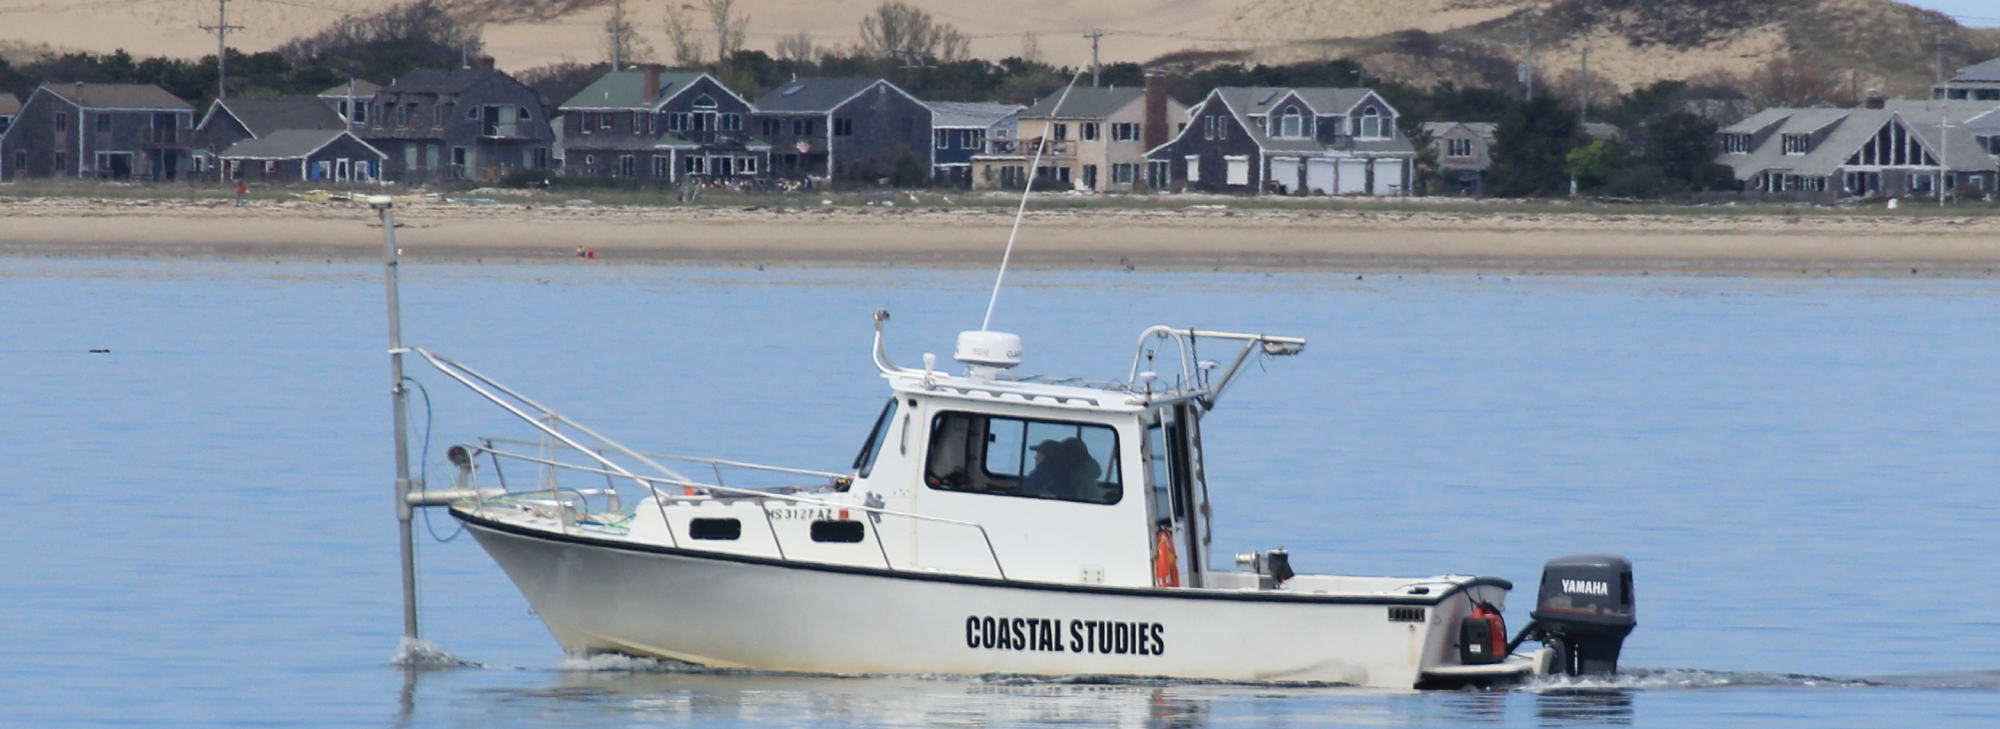
Bathymetry, by definition is the measurement of depth in a body of water, but is commonly referred to as the topography of underwater terrain. Until the 1920s water depth was measured by the lead and line method in which a lead weight attached to a line was dropped from the deck of a ship into the ocean. The weight would sink to the bottom and the length of the line was measured to get the water depth. Echo sounding devices, first developed in 1915, eventually replaced the lead and line method for the measurement of water depth. The term sonar was first used in WWII and comes from the acronym Sound Navigation and Ranging.
Active sonar, used for the collection of bathymetric data, creates a pulse of sound, or ‘ping’, and then measures the angle and the return time of the echo to get depth soundings. A cross-track profile of the seafloor is generated from thousands of soundings per acoustic ping. Bathymetric maps are derived from the three-dimensional data associated with each sounding comprising a horizontal component (x, y), and depth (z).
Along with bathymetry, the Cape Lab also collects sidescan sonar data. Sidescan sonar refers to paired conical-beam transducers that use sound to image the seafloor. By measuring the backscatter intensity (the sound signals returning to the transducer), objects can be identified along the seafloor. Different objects on the seafloor will either absorb (mud) or reflect (rocky material) the sound produced by the transducers, which is recorded as different intensities to create the image. We use an Edgetech 6205 Phase-Measuring Sidescan Sonar to collect coincident swath bathymetry and sidescan sonar imagery at high resolution. As a duel frequency sidescan sonar, it operates at both 550 khz and 1600 khz.
